UNITED STATES
SECURITIES AND EXCHANGE COMMISSION
WASHINGTON, D.C. 20549
FORM 10-K
|
| |
x | ANNUAL REPORT PURSUANT TO SECTION 13 OR 15(d) OF |
| THE SECURITIES EXCHANGE ACT OF 1934 |
For the fiscal year ended December 31, 2016
or
|
| |
o | TRANSITION REPORT PURSUANT TO SECTION 13 OR 15(d) OF |
| THE SECURITIES EXCHANGE ACT OF 1934 |
For the transition period from ________________________________ to ________________________________
Commission File Number: 001-31458
|
|
Drive Shack Inc. |
(Exact name of registrant as specified in its charter) |
|
| | |
Maryland | | 81-0559116 |
(State or other jurisdiction of incorporation | | (I.R.S. Employer Identification No.) |
or organization) | | |
|
| | |
1345 Avenue of the Americas, New York, NY | | 10105 |
(Address of principal executive offices) | | (Zip Code) |
Registrant's telephone number, including area code: (212) 798-6100
Securities registered pursuant to Section 12 (b) of the Act:
|
| | |
Title of each class: | | Name of exchange on which registered: |
Common Stock, $0.01 par value per share | | New York Stock Exchange (NYSE) |
9.75% Series B Cumulative Redeemable Preferred | | |
Stock, $0.01 par value per share | | New York Stock Exchange (NYSE) |
8.05% Series C Cumulative Redeemable Preferred | | |
Stock, $0.01 par value per share | | New York Stock Exchange (NYSE) |
8.375% Series D Cumulative Redeemable Preferred | | |
Stock, $0.01 par value per share | | New York Stock Exchange (NYSE) |
Securities registered pursuant to Section 12 (g) of the Act: None
Indicate by check mark if the registrant is a well-known seasoned issuer, as defined in Rule 405 of the Securities Act.
o Yes x No
Indicate by check mark if the registrant is not required to file reports pursuant to Section 13 or Section 15(d) of the Act.
o Yes x No
Indicate by check mark whether the registrant (1) has filed all reports required to be filed by Section 13 or 15(d) of the Securities Exchange Act of 1934 during the preceding 12 months (or for such shorter period that the registrant was required to file such reports), and (2) has been subject to such filing requirements for the past 90 days.
x Yes o No
Indicate by check mark whether the registrant has submitted electronically and posted on its corporate Web site, if any, every Interactive Data File required to be submitted and posted pursuant to Rule 405 of Regulation S-T (§232.405 of this chapter) during the preceding 12 months (or for such shorter period that the registrant was required to submit and post such files).
x Yes o No
Indicate by check mark if disclosure of delinquent filers pursuant to Item 405 of Regulation S-K is not contained herein, and will not be contained, to the best of registrant’s knowledge, in definitive proxy or information statements incorporated by reference in Part III of this Form 10-K or any amendment to this form 10-K o
Indicate by check mark whether the registrant is a large accelerated filer, an accelerated filer, a non-accelerated filer, or smaller reporting company. See definition of “large accelerated filer”, “accelerated filer” and “smaller reporting company” in Rule 12b-2 of the Exchange Act. (Check One):
|
| | | |
Large Accelerated Filer o | Accelerated Filer x | Non-accelerated Filer o | Smaller Reporting Company o |
Indicate by check mark whether the registrant is a shell company (as defined in Rule 12b-2 of the Exchange Act). (Check One):
o Yes x No
The aggregate market value of the common stock held by non-affiliates as of June 30, 2016 (computed based on the closing price on such date as reported on the NYSE) was: $299.2 million.
The number of shares outstanding of the registrant’s common stock was 66,842,378 as of February 22, 2017.
CAUTIONARY NOTE REGARDING FORWARD LOOKING STATEMENTS
This report contains certain “forward-looking statements” within the meaning of the Private Securities Litigation Reform Act of 1995. Such forward-looking statements relate to, among other things, the operating performance of our investments, the stability of our earnings, and our financing needs. Forward-looking statements are generally identifiable by use of forward-looking terminology such as “may,” “will,” “should,” “potential,” “intend,” “expect,” “endeavor,” “seek,” “anticipate,” “estimate,” “overestimate,” “underestimate,” “believe,” “could,” “project,” “predict,” “continue” or other similar words or expressions. Forward-looking statements are based on certain assumptions, discuss future expectations, describe future plans and strategies, contain projections of results of operations or of financial condition or state other forward-looking information. Our ability to predict results or the actual outcome of future plans or strategies is inherently uncertain. Although we believe that the expectations reflected in such forward-looking statements are based on reasonable assumptions, our actual results and performance could differ materially from those set forth in the forward-looking statements. These forward-looking statements involve risks, uncertainties and other factors that may cause our actual results in future periods to differ materially from forecasted results. Factors which could have a material adverse effect on our operations and future prospects include, but are not limited to:
|
| | |
| • | the ability to retain and attract members to our golf properties; |
| • | changes in global, national and local economic conditions, including, but not limited to, changes in consumer spending patterns, a prolonged economic slowdown and a downturn in the real estate market; |
| • | effects of unusual weather patterns and extreme weather events, geographical concentrations with respect to our operations and seasonality of our business; |
| • | competition within the industries in which we operate or may pursue additional investments; |
| • | material increases in our expenses, including but not limited to unanticipated labor issues or costs with respect to our workforce, and costs of goods, utilities and supplies; |
| • | our inability to sell or exit certain properties, and unforeseen changes to our ability to develop, redevelop or renovate certain properties; |
| • | difficulty monetizing our real estate debt investments; |
| • | liabilities with respect to inadequate insurance coverage, accidents or injuries on our properties, adverse litigation judgments or settlements, or membership deposits; |
| • | changes to and failure to comply with relevant regulations and legislation, including in order to maintain certain licenses and permits, and environmental regulations in connection with our operations; |
| • | inability to execute on our growth and development strategy by successfully developing, opening and operating new sites; |
| • | impacts of failures of our information technology and cybersecurity systems; |
| • | the impact of any current or further legal proceedings and regulatory investigations and inquiries; |
| • | the impact of any material transactions with FIG LLC (the "Manager") or one of its affiliates, including the impact of any actual, potential or predicted conflicts of interest; |
| • | effects of the pending merger of Fortress Investment Group LLC with affiliates of SoftBank Group Corp.; and |
| • | other risks detailed from time to time below, particularly under the heading “Risk Factors,” and in our other reports filed with or furnished to the Securities and Exchange Commission (the “SEC”). |
Although we believe that the expectations reflected in the forward-looking statements are reasonable, we cannot guarantee future results, levels of activity, performance or achievements. The factors noted above could cause our actual results to differ significantly from those contained in any forward-looking statement.
Readers are cautioned not to place undue reliance on any of these forward-looking statements, which reflect our management’s views only as of the date of this report. We are under no duty to update any of the forward-looking statements after the date of this report to conform these statements to actual results.
|
|
DRIVE SHACK INC. |
FORM 10-K |
INDEX |
PART I
Item 1. Business.
Overview
Drive Shack Inc. (and with its subsidiaries, “Drive Shack Inc.” or the “Company”) is a leading owner and operator of golf-related leisure and entertainment businesses. Drive Shack Inc. conducts its business through three primary segments: (1) Traditional Golf properties, (2) Entertainment Golf venues and (3) Debt Investments.
On December 28, 2016, the Company changed its name from Newcastle Investment Corp. to Drive Shack Inc. in connection with its transformation to a leisure and entertainment company. The Company was formed in 2002 and its common stock is traded on the NYSE under the symbol “DS.”
| |
• | Traditional Golf | American Golf |
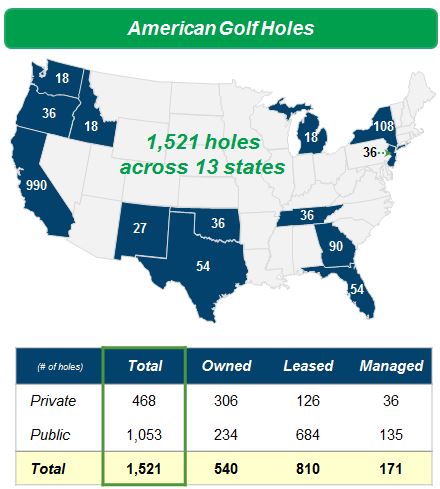
American Golf is one of the largest owners and operators of golf properties in the United States. As of December 31, 2016, we owned, leased or managed 78 properties across 13 states. American Golf and its dedicated employees are focused on delivering lasting experiences for our customers, including our more than 50,000 members, who played over 4 million rounds at our courses in 2016.
American Golf was acquired by Drive Shack Inc. in December 2013, when the Company restructured an existing mezzanine debt investment related to NGP Realty Sub, L.P. and American Golf Corporation (together, “American Golf”). As part of the restructuring, Drive Shack Inc. acquired the equity of American Golf’s indirect parent, AGC Mezzanine Pledge LLC.
Our operations are organized into three principal categories: (1) Public Properties, (2) Private Properties and (3) Managed Properties.
Public Properties. Our 49 public properties generate revenues principally through daily green fees, golf cart rentals and food, beverage and merchandise sales. Amenities at these properties generally include practice facilities and pro shops with food and beverage facilities. In some cases, our public properties have small clubhouses with banquet facilities. In addition, The Players Club is a monthly membership program offered at most of our public properties, with membership benefits ranging from daily range access to ability to participate in golf clinics, in return for a monthly membership fee.
Private Properties. Our 19 private properties are open to members only and generate revenues principally through initiation fees, membership dues, guest fees, and food, beverage and merchandise sales. Amenities at these courses typically include practice facilities, full service clubhouses with a pro shop, locker room facilities and multiple food and beverage outlets, including grills, restaurants and banquet facilities.
Managed Properties. Our 10 managed properties are properties that American Golf manages pursuant to a management agreement with the owner of each property. We recognize revenue from these properties in an amount equal to the respective management fee.
| |
• | Entertainment Golf | Drive Shack |
Drive Shack is an entertainment company that combines golf, competition, dining and fun. Drive Shack plans to open a chain of next-generation entertainment golf venues across the United States and internationally, with each venue featuring multiple stories of hitting suites where friends, family, co-workers or complete strangers may compete in a technologically-enhanced golf games. Consumers who are seeking a good time, but not looking to participate in the game, would be able to spectate from one of Drive Shack’s restaurant or lounge areas. Drive Shack is developing its inaugural site in Orlando, Florida.
| |
• | Debt Investments | Loans & Securities |
The Company historically invested in loans and securities. As the Company continues to transform to a leisure and entertainment company, under the name Drive Shack, management is working to optimize and monetize the loans and securities owned through pay downs and sales.
As of December 31, 2016, our debt investment portfolio consists primarily of agency Fannie Mae/Freddie Mac (“FNMA/FHLMC”) securities and our investment in a resorts-related loan as described below.
As of December 31, 2016, we hold 15 Agency FNMA/FHLMC fixed rate securities with a carrying value of $627.3 million. See Note 5 to Part II, Item 8. “Financial Statements and Supplementary Data” for additional information about our agency FNMA/FHLMC securities.
In April 2010, we made a cash investment of $75.0 million through two of our CDOs in a new loan to Intrawest Cayman L.P. and its subsidiaries (“Intrawest”), which is a portfolio company of private equity funds managed by an affiliate of our Manager. In addition, Mr. Wesley R. Edens is Chairman of our board of directors and a director of Intrawest, and has an indirect ownership interest in Intrawest. Interest on the loan is accrued and deferred until maturity in 2019. In accordance with the loan agreement, as of April 24, 2015, the accrued and deferred interest rate stepped-up from 15.55% to 22.50%. On September 23, 2016, Drive Shack Inc. received a $109.9 million pay down on this loan. The face amount of the loan was $61.0 million as of December 31, 2016. Interest accrued on the loan accounts for a significant portion of our interest income and Core Earnings (as defined in Part II, Item 6. “Selected Financial Data” under “Core Earnings”). We could be adversely affected if we are unable to recover our investment in the loan.
For a further discussion of the change in our reportable segments in addition to financial results, see Note 4 to Part II, Item 8. “Financial Statements and Supplementary Data.” See Note 13 to Part II, Item 8 “Financial Statements and Supplementary Data” for additional information about transactions with affiliates and affiliated entities.
Developments in 2016
Traditional Golf - Long-Term Financing
In June 2016, the Company obtained third-party financing on 22 traditional golf properties for a total of $102.0 million and used $64.9 million of the proceeds to repay its golf loans repurchase agreement. See Note 11 to Part II, Item 8. “Financial Statements and Supplementary Data” for additional information.
Traditional Golf - Property Updates
In January 2016, the lease on a golf property in Oregon expired and we did not renew the lease for such property. In July 2016, the lease on a golf property in California was terminated and we exited the property. In October 2016, the leases of certain golf properties in Georgia and California expired and we exited the properties. In October 2016, we also entered into a management agreement for an 18-hole golf property in Tustin, California, for a term of 4.5 years. In December 2016, the lease on a golf property in Oklahoma expired and we exited the property.
Entertainment Golf - Announced Inaugural Site
During November, the Company announced plans to develop its first entertainment golf venue, a three-story, innovative driving range and restaurant venue in Orlando, Florida.
Debt Investments - Continued Monetization
On September 23, 2016, we received a $109.9 million pay down on a corporate loan in the resorts industry (“the resort-related loan”) as further detailed in the “Debt Investments” section below. These proceeds will be used to reinvest in the development of Entertainment Golf. See Note 13 to Part II, Item 8. “Financial Statements and Supplementary Data” for additional information.
Corporate Shift - New Management & Structure
In September 2016, a new management team was put in place to drive the strategic priorities of the Company in its continued transformation to a leisure and entertainment company from a financial services company. In connection with this transformation, on February 23, 2017, the Company revoked its election to be treated as a real estate investment trust (“REIT”) effective January 1, 2017. The Company operated in a manner intended to qualify as a REIT for federal income tax purposes through December 31, 2016. See Note 15 to Part II, Item 8. “Financial Statements and Supplementary Data” for additional information.
Debt Obligations
Details regarding our debt obligations are presented in Part II, Item 7. “Management’s Discussion and Analysis of Financial Condition and Results of Operations - Liquidity and Capital Resources,” as well as Note 11 to Part II, Item 8. “Financial Statements and Supplementary Data.”
Our Investment Guidelines
In connection with our decision to terminate our election to be treated as a REIT (as discussed above), our board of directors approved updates to our investment guidelines to remove any REIT-related compliance requirements.
Our investment guidelines are purposefully broad to enable us to make investments in a wide array of assets. Our investment guidelines state:
| |
• | no investment is to be made which would cause us to be regulated as an investment company; |
| |
• | no more than 20% of our total equity, determined as of the date of such investment, is to be invested in any single asset; |
| |
• | our leverage (as defined in our governing documents) is not to exceed 90% of the sum of our total debt and total equity; and |
| |
• | we are not to co-invest with the Manager or any of its affiliates unless (i) our co-investment is otherwise in accordance with these guidelines and (ii) the terms of such co-investment are at least as favorable to us as to the Manager or such affiliate (as applicable) making such co-investment. |
These investment guidelines may be changed by our board of directors without the approval of our stockholders. We do not have specific policies as to the allocation among type of investment categories.
The Management Agreement
We are party to an amended and restated management agreement with FIG LLC, our Manager and an affiliate of Fortress (the “Management Agreement”), pursuant to which our Manager provides for a management team and other professionals who are responsible for implementing our business strategy, subject to the supervision of our board of directors. Our Manager is responsible for, among other things, (i) setting investment criteria in accordance with broad investment guidelines adopted by our board of directors, (ii) sourcing, analyzing and executing acquisitions, (iii) providing financial and accounting management services and (iv) performing other duties as specified in the Management Agreement.
The Management Agreement provides for automatic one year extensions. Our independent directors review our Manager’s performance annually and the Management Agreement may be terminated annually upon the affirmative vote of at least two-thirds of our independent directors, or by a vote of the holders of a majority of the outstanding shares of our common stock, based upon unsatisfactory performance that is materially detrimental to us or a determination by our independent directors that the management fee earned by our Manager is not fair, subject to our Manager’s right to prevent such a management fee compensation termination by accepting a mutually acceptable reduction of fees. Our Manager must be provided with 60 days’ prior notice of any such termination and would be paid a termination fee equal to the amount of the management fee earned by our Manager during the twelve month period preceding such termination, which may make it difficult and costly for us to terminate the management agreement. Following any termination of the Management Agreement, we shall be entitled to purchase our Manager’s right to receive the Incentive Compensation at a price determined as if our assets were sold for cash at their then current fair market value (as determined by an appraisal, taking into account, among other things, the expected future value of the underlying investments) or otherwise we may continue to pay the Incentive Compensation to our Manager. In addition, if we do not purchase our Manager’s Incentive Compensation, our Manager may require us to purchase the same at the price discussed above. In addition, the Management Agreement may be terminated by us at any time for cause.
In connection with our decision to terminate our election to be treated as a REIT (as discussed above), our board of directors approved the entry into an amended and restated Management Agreement with FIG LLC, our Manager and an affiliate of Fortress, effective January 1, 2017, to remove any REIT-related compliance requirements and to reflect our decision to change our name to Drive Shack Inc.
On February 14, 2017, Fortress announced that it had entered into an Agreement and Plan of Merger (the “Merger Agreement”) with an affiliate of SoftBank Group Corp. (“SoftBank”), pursuant to which Fortress will become a wholly owned subsidiary of the SoftBank affiliate (the “Merger”). In connection with the Merger, Fortress will operate within SoftBank as an independent business headquartered in New York. Fortress’s senior investment professionals are expected to remain in place, including those individuals who perform services for us.
See Note 13 to Part II, Item 8. “Financial Statements and Supplementary Data” for further information related to the terms of the management agreement.
Policies with Respect to Certain Other Activities
Subject to the approval of our board of directors, we have the authority to offer our common stock or other equity or debt securities in exchange for property and to repurchase or otherwise reacquire our shares or any other securities and may engage in such activities in the future. We also may make loans to, or provide guarantees of certain obligations of, our subsidiaries. We may engage in the purchase and sale of investments. Our officers and directors may change any of these policies and our investment guidelines without a vote of our stockholders. In the event that we determine to raise additional equity capital, our board of directors has the authority, without stockholder approval (subject to certain NYSE requirements), to issue additional common stock or preferred stock in any manner and on such terms and for such consideration it deems appropriate, including in exchange for property. Decisions regarding the form and other characteristics of the financing for our investments are made by our Manager subject to the general investment guidelines adopted by our board of directors.
Competition
We operate in a highly competitive industry, and compete primarily on the basis of reputation, location and the perceived value of our properties and facilities. Our ability to compete with other golf and entertainment facilities directly affects our ability to succeed.
In addition, we are subject to significant competition in seeking investments. We compete with other companies, including publicly traded golf, leisure and/or entertainment companies, private equity firms and other investors including funds and companies
affiliated with our Manager. Some of our competitors have greater resources than we possess, or have greater access to capital or various types of financing than are available to us, and we may not be able to compete successfully for investments or provide attractive investments returns relative to our competitors. In addition, we cannot assure you that we will be able to identify opportunities or complete transactions on commercially reasonable terms or at all, or that we will actually realize any targeted benefits from such acquisitions, investments or alliances.
We also compete for discretionary leisure and entertainment spending with other types of recreational and entertainment facilities, including entertainment retail and restaurants. Some of these establishments may exist in multiple locations, and we may also face competition in the future from other entertainment retail concepts that are similar to ours.
For more information about the competition we face generally and in our Traditional and Entertainment Golf businesses specifically, see Part I, Item 1A. “Risk Factors—Risks Related to Our Business—Competition in the industry in which we operate could have a material adverse effect on our business and results of operations.”
Seasonality
Traditional Golf is subject to seasonal fluctuations caused by significant reductions in golf activities as well as revenue in the first and fourth quarters of each year, due to shorter days and colder temperatures. Consequently, a significantly larger portion of our revenue from our Traditional Golf operations is earned in the second and third quarters of our fiscal year. In addition, severe weather patterns can also negatively impact our results of operations.
Government Regulation of Our Traditional Golf Business
Our Traditional Golf properties and operations are subject to a number of environmental laws. As a result, we may be required to incur costs to comply with the requirements of these laws, such as those relating to water resources, discharges to air, water and land, the handling and disposal of solid and hazardous waste, and the cleanup of properties affected by regulated materials. Under these and other environmental requirements, we may be required to investigate and clean up hazardous or toxic substances or chemical releases from currently owned, formerly owned or operated facilities.
Environmental laws typically impose cleanup responsibility and liability without regard to whether the relevant entity knew of or caused the presence of the contaminants. We may use certain substances and generate certain wastes that may be deemed hazardous or toxic under such laws, and from time to time have incurred, and in the future may incur, costs related to cleaning up contamination resulting from historic uses of certain of our current or former properties or our treatment, storage or disposal of wastes at facilities owned by others. Our facilities are also subject to risks associated with mold, asbestos and other indoor building contaminants. The costs of investigation, remediation or removal of regulated materials may be substantial, and the presence of those substances, or the failure to remediate a property properly, may impair our ability to use, transfer or obtain financing for our property. We may be required to incur costs to remediate potential environmental hazards, mitigate environmental risks in the future, or comply with other environmental requirements.
In addition, in order to improve, upgrade or expand some of our facilities, we may be subject to environmental review under the National Environmental Policy Act and, for projects in California, the California Environmental Quality Act. Both acts require that a specified government agency study any proposal for potential environmental impacts and include in its analysis various alternatives. Any improvement proposal may not be approved or may be approved with modifications that substantially increase the cost or decrease the desirability of implementing the project.
We are also subject to regulation by the United States Occupational Safety and Health Administration and similar health and safety laws in other jurisdictions. These regulations impact a number of aspects of operations, including golf course maintenance and food handling and preparation.
The ownership and operation of our facilities subjects us to federal, state and local laws regulating zoning, land development, land use, building design and construction, and other real estate-related laws and regulations.
Our facilities and operations are subject to the Americans with Disabilities Act of 1990, as amended by the ADA Amendments Act of 2008 (the “ADA”). The rules implementing the ADA have been further revised by the ADA Amendments Act of 2008, which included additional compliance requirements for golf facilities and recreational areas. The ADA generally requires that we remove architectural barriers when readily achievable so that our facilities are made accessible to people with disabilities. Noncompliance could result in imposition of fines or an award of damages to private litigants. Federal legislation or regulations may further amend the ADA to impose more stringent requirements with which we would have to comply.
We are also subject to various local, state and federal laws, regulations and administrative practices affecting our business. For instance, we must comply with provisions regulating equal employment, minimum wages, and licensing requirements and regulations for the sale of food and alcoholic beverages.
Taxation
On February 23, 2017, the Company revoked its election to be treated as a real estate investment trust (“REIT”), effective January 1, 2017. The Company operated in a manner intended to qualify as a REIT for federal income tax purposes through December 31, 2016. Beginning January 1, 2017, we are generally subject to federal income tax, including any applicable alternative minimum tax, on our taxable income at regular corporate rates, and distributions to stockholders declared on or after January 1, 2017 are not deductible by us in computing our taxable income. Any such corporate tax liability could be substantial, including due to certain deferred cancellation of indebtedness income. Although we have net operating losses that may be available to reduce our taxable income for U.S. federal income tax purposes and thereby reduce this tax liability, no assurances can be given that those losses will remain usable or will not become subject to limitations (including under Section 382 of the Code), and those losses may in any event not be usable in reducing our income for alternative minimum tax, state, local or other tax purposes. In particular, as discussed in more detail below, if the Company has undergone or were to undergo an “ownership change” for purposes of Section 382 of the Code, the Company could incur materially greater tax liability than if the Company had not undergone such an ownership change. For additional information, see Part I, Item 1A. “Risk Factors.”
Employees
As described above under “– The Management Agreement,” we are managed by FIG LLC, an affiliate of Fortress Investment Group LLC. As a result, except in our golf operations which are discussed below, we have no employees. The employees of FIG LLC are not a party to any collective bargaining agreements.
Traditional Golf and Entertainment Golf
As of December 31, 2016, there were approximately 4,700 employees at our golf facilities, consisting primarily of hourly employees. Other than a small group of golf course maintenance staff at one of our clubs, our employees are not unionized. We believe we have a good working relationship with our employees, and our business has not experienced interruptions as a result of labor disputes.
Corporate Governance and Internet Address; Where Readers Can Find Additional Information
We emphasize the importance of professional business conduct and ethics through our corporate governance initiatives. Our board of directors consists of a majority of independent directors; the Audit, Compensation and Nominating and Corporate Governance committees of our board of directors are composed exclusively of independent directors. We have adopted corporate governance guidelines, and a code of business conduct and ethics, which delineate our standards for our officers and directors, and employees of our Manager.
Drive Shack Inc. files annual, quarterly and current reports, proxy statements and other information required by the Securities Exchange Act of 1934, as amended (the ‘‘Exchange Act’’), with the SEC. Readers may read and copy any document that Drive Shack Inc. files at the SEC’s Public Reference Room located at 100 F Street, N.E., Washington, D.C. 20549, U.S.A. Please call the SEC at 1-800-SEC-0330 for further information on the Public Reference Room. Our SEC filings are also available to the public from the SEC’s internet site at http://www.sec.gov.
Our internet site is http://www.driveshack.com. We make available free of charge through our internet site our annual reports on Form 10-K, quarterly reports on Form 10-Q, current reports on Form 8-K, proxy statements and Forms 3, 4 and 5 filed on behalf of directors and executive officers and any amendments to those reports filed or furnished pursuant to the Exchange Act as soon as reasonably practicable after we electronically file such material with, or furnish it to, the SEC. Also posted on our website in the ‘‘Investor Relations—Corporate Governance” section are charters for the Company’s Audit Committee, Compensation Committee and Nominating and Corporate Governance Committee as well as our Corporate Governance Guidelines and our Code of Business Conduct and Ethics governing our directors, officers and employees. Information on, or accessible through, our website is not a part of, and is not incorporated into, this report.
Item 1A. Risk Factors
Before you invest in our common stock, you should carefully consider the risks involved, including the risks set forth below.
Risks Related to Our Business
We may not be able to retain members at our public and private properties, and attract golf rounds played, which could harm our business, financial condition and results of operations.
Our success depends on our ability to retain members at our public and private properties, attract golf rounds played and maintain or increase revenues generated from our properties. Changes in consumer financial condition, leisure tastes and preferences, particularly those affecting the popularity of golf, and other social and demographic trends could adversely affect our business. Significant periods where attrition rates exceed enrollment rates or where facilities usage is below historical levels would have a material adverse effect on our business, results of operations and financial condition. If we cannot attract new members, retain our existing members, or maintain golf rounds played, our financial condition and results of operations could be harmed.
Changes in consumer financial condition, leisure tastes and preferences, spending patterns, particularly discretionary expenditures for leisure and recreation, are subject to factors beyond our control that may impact our business, financial condition and results of operations.
Consumer spending patterns, particularly discretionary expenditures for leisure and recreation, are subject to factors beyond our control that may impact our business, including demand for memberships, golf rounds played, and food and beverage sales. These factors include:
| |
• | economic recessions or downturns; |
| |
• | low consumer confidence and outlook; |
| |
• | depressed housing markets; |
| |
• | decreased corporate spending, including on events or tournaments; |
| |
• | natural disasters, such as earthquakes, tornadoes, hurricanes, wildfires, blizzards, droughts and floods; |
| |
• | outbreaks of epidemic, pandemic or contagious diseases; |
| |
• | war, terrorist activities or threats and heightened travel security measures instituted in response to these events; and |
| |
• | the financial condition of the airline, automotive and other transportation-related industries and its impact on travel. |
These factors and other global, national and regional conditions can adversely affect, and from time to time have adversely affected, individual properties, particular regions or our business as a whole. Any one or more of these factors could limit or reduce demand or the rates are able to charge for our memberships, services, or rounds, which could harm our business and results of operations.
Our businesses will remain subject to future economic recessions or downturns, and any significant adverse shift in increased unemployment and general economic conditions, whether local, regional, national or global, or in geographic areas in which we have concentrations of golf properties, such as California, may have a material adverse effect on our business, financial condition and results of operations. During such periods of adverse economic conditions, we may be unable to increase membership dues or the price of our rounds, products and services and may experience increased rates of resignations of existing members, a decrease in the rate of new member enrollment, a decrease in golf rounds played or reduced spending on our properties, any of which may result in, among other things, financial losses and decreased revenues.
Unusual weather patterns and extreme weather events, as well as periodic and quasi-periodic weather patterns, could adversely affect the value of our golf courses or negatively impact our business and results of operations.
Our golf business is subject to various risks that may not apply to our other investments. For example, unusual weather patterns
and extreme weather events, such as heavy rains, prolonged snow accumulations, high winds, extended heat waves and drought, could negatively affect the income generated by our facilities. The maintenance of satisfactory turf grass conditions on our golf properties requires significant amounts of water. Our ability to irrigate a golf course could be adversely affected by a drought or other cause of water shortage, such as government imposed restrictions on water usage. Additionally, we may be subject to significant increases in the cost of water. We have a concentration of golf facilities in states (such as California, Georgia, New York and Texas) that experience periods of unusually hot, cold, dry or rainy weather. Unfavorable weather patterns in such states, or any other circumstance or event that causes a prolonged disruption in the operations of our facilities in such states (including, without limitation, economic and demographic changes in these areas), could have a particularly adverse impact on our Traditional Golf business. See “–We may not be able to retain members and attract golf rounds played, which could harm our business, financial condition and results of operations” and “–Economic recessions or downturns could negatively affect our business, financial condition and results of operations.”
We have significant operations concentrated in certain geographic areas, and any disruption in the operations of our properties in any of these areas could harm our results of operations.
As of December 31, 2016, we operated multiple golf properties in several metropolitan areas, including 31 in the greater Los Angeles, California region. As a result, any prolonged disruption in the operations of our properties in any of these markets, whether due to technical difficulties, power failures or destruction or damage to the properties as a result of a natural disaster, fire or any other reason, could harm our results of operations or may result in property closures. In addition, some of the metropolitan areas where we operate properties could be disproportionately affected by regional economic conditions, such as declining home prices and rising unemployment. Concentration in these markets increases our exposure to adverse developments related to competition, as well as economic and demographic changes in these areas.
Seasonality may adversely affect our business and results of operations.
Seasonality will affect our golf business’s results of operations. Usage of golf facilities tends to decline significantly during the first and fourth quarters, when colder temperatures and shorter days reduce the demand for outdoor activities. As a result, we expect the golf business to generate a disproportionate share of its annual revenue in the second and third quarters of each year. Accordingly, our golf business is especially vulnerable to events that may negatively impact its operations during the second and third quarters, when guest and member usage is highest.
Competition in the industry in which we operate could have a material adverse effect on our business and results of operations.
We operate in a highly competitive industry, and compete primarily on the basis of reputation, featured facilities, location, quality and breadth of member product offerings and price. As a result, competition for market share in the industry in which we compete is significant. In order to succeed, we must take market share from local and regional competitors and sustain our membership base in the face of increasing recreational alternatives available to our existing and prospective members. Our business properties compete on a local and regional level with restaurants and other business and social clubs. The number and variety of competitors in this business varies based on the location and setting of each facility, with some situated in intensely competitive upscale urban areas characterized by frequent innovations in the products and services offered by competing restaurants and other business, dining and social clubs. In addition, in most regions, these businesses are in constant flux as new restaurants and other social and meeting venues open or expand their amenities. As a result of these characteristics, the supply in a given region often exceeds the demand for such facilities, and any increase in the number or quality of restaurants and other social and meeting venues, or the products and services they provide, in a given region could significantly impact the ability of our properties to attract and retain members, which could harm our business and results of operations.
Our golf properties compete on a local and regional level with other country clubs and golf properties. The level of competition in the golf business varies from region to region and is subject to change as existing facilities are renovated or new facilities are developed. An increase in the number or quality of similar clubs and other facilities in a particular region could significantly increase competition, which could have a negative impact on our business and results of operations.
Our results of operations also could be affected by a number of additional competitive factors, including the availability of, and demand for, alternative venues for recreational pursuits, such as multi-use sports and athletic centers. In addition, member-owned and individual privately-owned clubs may be able to create a perception of exclusivity that we have difficulty replicating given the diversity of our portfolio and the scope of our holdings. To the extent these alternatives succeed in diverting actual or prospective members away from our facilities or affect our membership rates, our business and results of operations could be harmed.
Our large workforce subjects us to risks associated with increases in the cost of labor as a result of increased competition for employees, higher employee turnover rates and required wage increases and health benefit coverage, lawsuits or labor union activity.
Labor is one of our primary property-level operating expenses. We may face labor shortages or increased labor costs because of increased competition for employees, higher employee turnover rates, or increases in the federal or state minimum wage or other employee benefit costs. For example, if the federal minimum wage were increased significantly, we would have to assess the financial impact on our operations as we have a large population of hourly employees. If labor-related expenses increase, our operating expense could increase and our business, financial condition and results of operations could be harmed.
We are subject to the Fair Labor Standards Act and various federal and state laws governing such matters as minimum wage requirements, overtime compensation and other working conditions, citizenship requirements, discrimination and family and medical leave. In recent years, a number of companies have been subject to lawsuits, including class action lawsuits, alleging violations of federal and state law regarding workplace and employment matters, overtime wage policies, discrimination and similar matters. A number of these lawsuits have resulted in the payment of substantial damages by the defendants. Similar lawsuits may be threatened or instituted against us from time to time, and we may incur substantial damages and expenses resulting from lawsuits of this type, which could have a material adverse effect on our business, financial condition or results of operations.
Increases in our cost of goods, rent, water, utilities and taxes could reduce our operating margins and harm our business, financial condition and results of operations.
Increases in operating costs due to inflation and other factors may not be directly offset by increased revenue. Our most significant operating costs, other than labor, are our cost of goods, water, utilities, rent and property taxes. Many, and in some cases all, of the factors affecting these costs are beyond our control. Our cost of goods such as food and beverage costs account for a significant portion of our total property-level operating expense. While we have not experienced material increases in the cost of goods, if our cost of goods increased significantly and we are not able to pass along those increased costs to our members in the form of higher prices or otherwise, our operating margins would suffer, which would have an adverse effect on our business, financial condition and results of operations.
In addition, rent accounts for a significant portion of our property-level operating expense. Significant increases in our rent costs would increase our operating expense and our business, financial condition and results of operations may suffer. The prices of utilities are volatile, and shortages sometimes occur. In particular, municipalities are increasingly placing restrictions on the use of water for golf course irrigation and increasing the cost of water. Significant increases in the cost of our utilities, or any shortages, could interrupt or curtail our operations and lower our operating margins, which could have a negative impact on our business, financial condition and results of operations.
Each of our properties is subject to real and personal property taxes. The real and personal property taxes on our properties may increase or decrease as tax rates change and as our properties are assessed or reassessed by taxing authorities. If real and personal property taxes increase, our financial condition and results of operations may suffer.
We could be required to make material cash outlays in future periods if the number of initiation deposit refund requests we receive materially increases or if we are required to surrender unclaimed initiation deposits to state authorities under applicable escheatment laws.
We may be required to make significant cash outlays in connection with initiation fee deposits. Members of our private properties are generally required to pay an initiation fee deposit upon their acceptance as a member and, in most cases, such deposits are fully refundable after a fixed number of years (typically 30 years) and upon the occurrence of other contract-specific conditions. While we will make a refund to any member whose initiation fee deposit is eligible to be refunded, we may be subject to various states’ escheatment laws with respect to initiation fee deposits that have not been refunded to members. All states have escheatment laws and generally require companies to remit to the state cash in an amount equal to unclaimed and abandoned property after a specified period of dormancy, which is typically 3 to 5 years. Moreover, most of the states in which we conduct business hire independent agents to conduct unclaimed and abandoned property audits. We currently do not remit to states any amounts relating to initiation fee deposits that are eligible to be refunded to members based upon our interpretation of the applicability of such laws to initiation fee deposits. The analysis of the potential application of escheatment laws to our initiation fee deposits is complex, involving an analysis of constitutional and statutory provisions and contractual and factual issues. While we do not believe that initiation fee deposits must be escheated, we may be forced to remit such amounts if we are challenged and fail to prevail in our position.
We have concentrated our investments in golf-related and business real estate and facilities, which are subject to numerous risks, including the risk that the values of our investments may decline if there is a prolonged downturn in real estate values.
Our operations consist almost entirely of golf properties that encompass a large amount of real estate holdings. Accordingly, we are subject to the risks associated with holding real estate investments. A prolonged decline in the popularity of traditional golf could adversely affect the value of our real estate holdings and could make it difficult to sell facilities or businesses.
Our real estate holdings (including our long-term leaseholds) are subject to risks typically associated with investments in real estate. The investment returns available from equity investments in real estate depend in large part on the amount of income earned, expenses incurred and capital appreciation generated by the related properties. In addition, a variety of other factors affect income from properties and real estate values, including governmental regulations, real estate, insurance, zoning, tax and eminent domain laws, interest rate levels and the availability of financing. For example, new or existing real estate zoning or tax laws can make it more expensive and time-consuming to expand, modify or renovate older properties. Under eminent domain laws, governments can take real property. Sometimes this taking is for less compensation than the owner believes the property is worth. Any of these factors could have an adverse impact on our business, financial condition or results of operations.
The illiquidity of real estate may make it difficult for us to dispose of one or more of our properties or negatively affect our ability to profitably sell such properties.
We may from time to time decide to dispose of one or more of our real estate assets. Because real estate holdings generally, and properties like ours in particular, are relatively illiquid, we may not be able to dispose of one or more real estate assets on a timely basis. In some circumstances, sales may result in investment losses which could adversely affect our financial condition. The illiquidity of our real estate assets could mean that we continue to operate a facility that management has identified for disposition. Failure to dispose of a real estate asset in a timely fashion, or at all, could adversely affect our business, financial condition and results of operations.
Timing, budgeting and other risks could delay our efforts to develop, redevelop or renovate the properties that we own, or make these activities more expensive, which could reduce our profits or impair our ability to compete effectively.
We must regularly expend capital to construct, maintain and renovate the properties that we own in order to remain competitive, pursue our business strategies, maintain and build the value and brand standards of our properties and comply with applicable laws and regulations. We must also periodically upgrade or replace the furniture, fixtures and equipment necessary to operate our business. These efforts are subject to a number of risks, including:
| |
• | construction delays or cost overruns (including labor and materials) that may increase project costs; |
| |
• | obtaining zoning, occupancy and other required permits or authorizations; |
| |
• | governmental restrictions on the size or kind of development; |
| |
• | force majeure events, including earthquakes, tornadoes, hurricanes or floods; |
| |
• | design defects that could increase costs; and |
| |
• | environmental concerns which may create delays or increase costs. |
Our insurance policies may not provide adequate levels of coverage against all claims and we may incur losses that are not covered by our insurance.
There are certain types of losses, generally of a catastrophic nature, such as earthquakes, floods, hurricanes, terrorism or acts of war, that may be uninsurable or not economically insurable. Inflation, changes in building codes and ordinances, environmental considerations, and other factors, including terrorism or acts of war, also might make the insurance proceeds insufficient to repair or replace a property, including a golf property, if it is damaged or destroyed. Under such circumstances, the insurance proceeds received might not be adequate to restore our economic position with respect to the affected real property. As a result of the events of September 11, 2001, insurance companies have limited or excluded coverage for acts of terrorism in insurance policies. As a result, we may suffer losses from acts of terrorism that are not covered by insurance.
In addition, the mortgage loans that are secured by certain of the properties in which we have interests contain customary covenants, including covenants that require property insurance to be maintained in an amount equal to the replacement cost of the properties. There can be no assurance that the lenders under these mortgage loans will not take the position that exclusions from coverage for losses due to terrorist acts is a breach of a covenant which, if uncured, could allow the lenders to declare an event of default and accelerate repayment of the mortgage loans.
Accidents or injuries in our properties or in connection with our operations may subject us to liability, and accidents or injuries could negatively impact our reputation and attendance, which would harm our business, financial condition and results of operations.
There are inherent risks of accidents or injuries at our properties or in connection with our operations, including injuries from premises liabilities such as slips, trips and falls. If accidents or injuries occur at any of our properties, we may be held liable for costs related to the injuries. We maintain insurance of the type and in the amounts that we believe are commercially reasonable and that are available to businesses in our industry, but there can be no assurance that our liability insurance will be adequate or available at all times and in all circumstances. There can also be no assurance that the liability insurance we have carried in the past was adequate or available to cover any liability related to previous incidents. Our business, financial condition and results of operations could be harmed to the extent claims and associated expenses resulting from accidents or injuries exceed our insurance recoveries.
The failure to comply with regulations relating to public facilities or the failure to retain licenses or permits relating to our properties may harm our business and results of operations.
Our business is subject to extensive federal, state and local government regulation in the various jurisdictions in which our properties are located, including regulations relating to alcoholic beverage control, public health and safety, environmental hazards and food safety. Alcoholic beverage control regulations require each of our properties to obtain licenses and permits to sell alcoholic beverages on the premises. Typically, licenses must be renewed annually and may be revoked or suspended for cause at any time. In some states, the loss of a license for cause with respect to one location may lead to the loss of licenses at all locations in that state and could make it more difficult to obtain additional licenses in that state. Alcoholic beverage control regulations relate to numerous aspects of the daily operations of each venue, including minimum age of patrons and employees, hours of operation, advertising, wholesale purchasing, inventory control and handling and storage and dispensing of alcoholic beverages.
The failure of a property to obtain or retain its licenses and permits would adversely affect that property’s operations and profitability, as well as our ability to obtain such a license or permit in other locations. We may also be subject to dram shop statutes in certain states, which generally provide a person injured by an intoxicated person the right to recover damages from an establishment that wrongfully served alcoholic beverages to the intoxicated person. Even though we are covered by general liability insurance, a settlement or judgment against us under a dram shop lawsuit in excess of liability coverage could have a material adverse effect on our operations.
We are also subject to the ADA which, among other things, may require certain renovations to our facilities to comply with access and use requirements. A determination that we are not in compliance with the ADA or any other similar law or regulation could result in the imposition of fines or an award of damages to private litigants. While we believe we are operating in substantial compliance, and will continue to remove architectural barriers in our facilities when readily achievable, in accordance with current applicable laws and regulations, there can be no assurance that our expenses for compliance with these laws and regulations will not increase significantly and harm our business, financial condition and results of operations.
Businesses operating in the private country club industry are also subject to numerous other federal, state and local governmental regulations related to building and zoning requirements and the use and operation of clubs, including changes to building codes and fire and life safety codes, which can affect our ability to obtain and maintain licenses relating to our business and properties. If we were required to make substantial modifications at our properties to comply with these regulations, our business, financial condition and results of operations could be negatively impacted.
Environmental compliance costs and liabilities related to real estate that we own, or in which we have interests, may adversely affect our results of operations.
Our operating costs may be affected by the cost of complying with existing or future environmental laws, ordinances and regulations with respect to the properties, or loans secured by such properties, or by environmental problems that materially impair the value of such properties. Under various federal, state and local environmental laws, ordinances and regulations, a current or previous owner or operator of real property may be liable for the costs of removal or remediation of hazardous or toxic substances on,
under, or in such property. Such laws often impose liability whether or not the owner or operator knew of, or was responsible for, the presence of such hazardous or toxic substances. In addition, the presence of hazardous or toxic substances, or the failure to remediate properly, may adversely affect the owner’s ability to borrow using such real property as collateral. Certain environmental laws and common law principles could be used to impose liability for releases of hazardous materials, including asbestos-containing materials, into the environment, and third parties may seek recovery from owners or operators of real properties for personal injury associated with exposure to released asbestos-containing materials or other hazardous materials. Environmental laws may also impose restrictions on the manner in which a property may be used or transferred or in which businesses it may be operated, and these restrictions may require expenditures. In connection with the direct or indirect ownership and operation of properties, we may be potentially liable for any such costs. The cost of defending against claims of liability or remediating contaminated property and the cost of complying with environmental laws could adversely affect our results of operations and financial condition.
Our growth strategy depends on our ability to develop and open new entertainment venues and operate them profitably.
A key element of our growth strategy is to develop and open entertainment golf venues. We have identified a number of sites for potential future entertainment golf venues. Our ability to develop and open these venues on a timely and cost-effective basis, or at all, is dependent on a number of factors, many of which are beyond our control, including but not limited to our ability to:
| |
• | reach acceptable agreements regarding the lease or purchase of locations; |
| |
• | comply with applicable zoning, licensing, land use and environmental regulations; |
| |
• | raise or have available an adequate amount of cash or currently available financing for construction and opening costs; |
| |
• | adequately complete construction for operations; |
| |
• | timely hire, train and retain the skilled management and other employees necessary to meet staffing needs; |
| |
• | obtain, for acceptable cost, required permits and approvals, including liquor licenses; and |
| |
• | efficiently manage the amount of time and money used to build and open each new venue. |
If we succeed in opening entertainment golf venues on a timely and cost-effective basis, we may nonetheless be unable to attract enough customers to these new venues because potential customers may be unfamiliar with our venue or concept, or our entertainment and menu options might not appeal to them. New venues may operate at a loss, which could have a significant adverse effect on our overall operating results. Opening new entertainment golf venues in an existing market of our competitors could reduce the revenue at our existing venues in that market.
Our procurement of certain materials for developing, redeveloping or renovating our venues is dependent upon a few suppliers.
Our ability to continue to procure certain materials is important to our business strategy for developing, redeveloping or renovating our venues. The number of suppliers from which we can purchase our materials is limited. To the extent that the number of suppliers declines, we could be subject to the risk of distribution delays, pricing pressure, lack of innovation and other associated risks which could adversely affect our business, financial condition or results of operations.
Changes in laws, regulations and other requirements could adversely affect our business, results of operations or financial condition.
We are also subject to federal, state and local environmental laws, regulations and other requirements. More stringent and varied requirements of local and state governmental bodies with respect to zoning, land use and environmental factors could delay or prevent development of new stores in particular locations. Environmental laws and regulations also govern, among other things, discharges of pollutants into the air and water as well as the presence, handling, release and disposal of and exposure to hazardous substances. These laws provide for significant fines and penalties for noncompliance. Third parties may also make personal injury, property damage or other claims against us associated with actual or alleged release of, or exposure to, hazardous substances at our properties. We could also be strictly liable, without regard to fault, for certain environmental conditions at properties we formerly owned or operated as well as our current properties.
Our investments in loans, and the loans underlying our investments in securities, are subject to delinquency, foreclosure and loss which could result in losses to us and expose us to additional risks.
Mortgage and asset-backed securities are bonds or notes backed by loans and/or other financial assets and include commercial mortgage-backed securities, FNMA/FHLMC securities, and real estate related asset-backed securities. The ability of a borrower
to repay these loans or other financial assets is dependent upon the income or assets of these borrowers. If a borrower has insufficient income or assets to repay these loans, it will default on its loan. While we intend to focus on real estate related asset-backed securities, there can be no assurance that we will not invest in other types of asset-backed securities.
Our investments in mortgage and asset-backed securities will be adversely affected by defaults under the loans underlying such securities. To the extent losses are realized on the loans underlying the securities in which we invest, we may not recover the amount invested in, or, in extreme cases, any of our investment in such securities.
Declines in real estate values could harm our results of operations.
We believe the risks associated with our business are more severe during periods in which an economic slowdown or recession is accompanied by declining real estate values. Borrowers may be less able to pay principal and interest on our loans, and the loans underlying our securities, if the economy weakens. Further, declining real estate values significantly increase the likelihood that we will incur losses on our loans and securities in the event of default because the value of our collateral may be insufficient to cover our basis. Any sustained period of increased payment delinquencies, foreclosures or losses could adversely affect our net interest income from loans and securities in our portfolio, as well as our ability to sell and securitize loans, which would significantly harm our revenues, results of operations, financial condition, liquidity, business prospects and our ability to make distributions to our stockholders. For more information on the impact of market conditions on our business and results of operations generally, see Part II, Item 7. “Management’s Discussion and Analysis of Financial Condition and Results of Operations–Market Considerations.”
Lawsuits, investigations and indemnification claims could result in significant liabilities and reputational harm, which could materially adversely affect our results of operations, financial condition and liquidity.
From time to time, we are and may become involved in lawsuits, inquiries or investigations or receive claims for indemnification. Our efforts to resolve any such lawsuits, inquiries, investigations or claims could be very expensive and highly damaging to our reputation, even if the underlying claims are without merit. We could potentially be found liable for significant damages or indemnification obligations. Such developments could have a material adverse effect on our business, results of operations and financial condition.
Our risk of litigation includes, but is not limited to, lawsuits that could be brought by users of our traditional golf properties and property-level employees in our Traditional Golf business. For instance, we are subject to federal and state laws governing minimum wage requirements, overtime compensation, discrimination and family and medical leave. Any lawsuit alleging a violation of any such laws could result in a settlement or other resolution that requires us to make a substantial payment, which could have a material adverse effect on our financial condition and results of operations. In addition, accidents or injuries in connection with our traditional golf properties could subject us to liability and reputational harm.
A failure in our systems or infrastructure which maintain our internal and customer data, or those of our third-party service providers, including as a result of cyber-attacks, could result in faulty business decisions or harm to our reputation or subject us to costs, fines or lawsuits.
Certain information relating to our members and guests, including personally identifiable information and credit card numbers, is collected and maintained by us, or by third-parties with which we do business or which facilitate our business activities. This information is maintained for a period of time for various business purposes, including maintaining records of member preferences to enhance our customer service and for billing, marketing and promotional purposes. We also maintain personally identifiable information about our employees. The integrity and protection of our customer, employee and company data is critical to our business. Our members and our employees expect that we will adequately protect their personal information, and the regulations applicable to security and privacy are increasingly demanding. Privacy regulation is an evolving area and compliance with applicable privacy regulations may increase our operating costs or adversely impact our ability to service our members and guests and market our properties and services to our members and guests.
To date we have not experienced any material losses relating to cyber-attacks, computer viruses or other systems or infrastructure failures. While we have cyber security procedures in place, given the evolving nature of these threats, there can be no assurance that we will not suffer material losses in the future due to cyber-attacks or other systems or infrastructure failures. A theft, loss, misappropriation, fraudulent or unlawful use of customer, employee or company data, including in connection with one or more cyber-attacks on us or one of our third-party providers, could harm our reputation, result in loss of members or business disruption or result in remedial and other costs, fines or lawsuits. In addition, non-compliance with applicable privacy regulations by us (or
in some circumstances non-compliance by third-parties engaged by us) could result in fines or restrictions on our use or transfer of data. Any of these matters could adversely affect our business, financial condition or results of operations.
We rely on information technology in our operations, and any material failure, inadequacy, interruption or security failure of that technology could harm our business.
We rely on information technology networks and systems, including the Internet, to process, transmit and store electronic information and to manage or support a variety of our business processes, including financial transactions and maintenance of records, which in the case of our Traditional Golf business, may include personal identifying information. We rely on commercially available systems, software, tools and monitoring to provide security for processing, transmitting and storing this confidential information, such as individually identifiable information relating to financial accounts. Although we have taken steps to protect the security of the data maintained in our information systems, it is possible that our security measures will not be able to prevent the systems’ improper functioning, or the improper disclosure of personally identifiable information such as in the event of cyber attacks. Security breaches, including physical or electronic break-ins, computer viruses, attacks by hackers and similar breaches, can create system disruptions, shutdowns or unauthorized disclosure of confidential information. Any failure to maintain proper function, security and availability of our information systems could interrupt our operations, damage our reputation, subject us to liability claims or regulatory penalties and could materially and adversely affect our business, financial condition and results of operations.
Our investments may be subject to significant impairment charges, which would adversely affect our results of operations.
We are required to periodically evaluate our investments for impairment indicators. The value of an investment is impaired when our analysis indicates that, with respect to a loan, it is probable that we will not be able to collect the full amount we intended to collect from the loan or, with respect to a security or golf property, it is probable that the value of the security or golf property is other than temporarily impaired. The judgment regarding the existence of impairment indicators is based on a variety of factors depending upon the nature of the investment and the manner in which the income related to such investment was calculated for purposes of our financial statements. If we determine that an impairment has occurred, we are required to make an adjustment to the net carrying value of the investment and the amount of accrued interest recognized as income from such investment, which could have a material adverse effect on our results of operations.
Market conditions could negatively impact our business, results of operations and financial condition.
The markets in which we operate are affected by a number of factors that are largely beyond our control but can nonetheless have a potentially significant, negative impact on us. These factors include, among other things:
| |
• | Interest rates and credit spreads; |
| |
• | The availability of credit, including the price, terms and conditions under which it can be obtained; |
| |
• | The quality, pricing and availability of suitable investments and credit losses with respect to our investments; |
| |
• | The ability to obtain accurate market-based valuations; |
| |
• | Loan values relative to the value of the underlying real estate assets; |
| |
• | Default rates on both residential and commercial mortgages and the amount of the related losses; |
| |
• | The actual and perceived state of the real estate markets, the U.S. economy and public capital markets generally; |
| |
• | Unemployment rates; and |
| |
• | The attractiveness of other types of investments relative to investments in real estate or generally. |
Changes in these factors are difficult to predict, and a change in one factor can affect other factors. For example, during 2007, increased default rates in the subprime mortgage market played a role in causing credit spreads to widen, reducing availability of
credit on favorable terms, reducing liquidity and price transparency of real estate related assets, resulting in difficulty in obtaining accurate mark-to-market valuations, and causing a negative perception of the state of the real estate. These conditions worsened during 2008, and intensified meaningfully during the fourth quarter of 2008 as a result of the global credit and liquidity crisis, resulting in extraordinarily challenging market conditions. Since then, despite recent market volatility, market conditions have generally improved, but they could deteriorate in the future for a variety of reasons.
We have assumed the role of manager of numerous CDOs previously managed by a third party. Each such engagement exposes us to a number of potential risks.
Changes within our industry may result in CDO collateral managers being replaced. In such instances, we have sought to be engaged as the collateral manager of CDOs currently managed by third parties. For example, in February 2011, one of our subsidiaries became the collateral manager of certain CDOs previously managed by C-BASS Investment Management LLC (“C-BASS”).
While being engaged as the collateral manager of such CDOs potentially enables us to grow our business, it also entails a number of risks that could harm our reputation, results of operations and financial condition. For example, we purchased the management rights with respect to the C-BASS CDOs pursuant to a bankruptcy proceeding. As a result, we were not able to conduct extensive due diligence on the CDO assets even though many classes of securities issued by the CDOs were rated as “distressed” by the rating agencies as of the most recent rating date prior to our becoming the collateral manager of the CDOs. We may willingly or unknowingly assume actual or contingent liabilities for significant expenses, we may become subject to new laws and regulations with which we are not familiar, and we may become subject to increased risk of litigation, regulatory investigation or negative publicity. For example, we determined that it would be prudent to register the subsidiary that became the collateral manager of the C-BASS CDOs as a registered investment adviser, which has increased our regulatory compliance costs. In addition to defending against litigation and complying with regulatory requirements, being engaged as collateral manager may require us to invest other resources for various other reasons, which could detract from our ability to capitalize on future opportunities. Moreover, being engaged as collateral manager may require us to integrate complex technological, accounting and management systems, which may be difficult, expensive and time-consuming and which we may not be successful in integrating into our current systems. In addition to the risk that we face if we are successful in becoming the manager of additional CDOs, we may attempt but fail to become the collateral manager of CDOs in the future, which could harm our reputation and subject us to costly litigation. Finally, if we include the financial performance of the C-BASS CDOs or other CDOs for which we become the collateral manager in our public filings, we are subject to the risk that, particularly during the period immediately after we become the collateral manager, this information may prove to be inaccurate or incomplete. The occurrence of any of these negative integration events could negatively impact our reputation with both regulators and investors, which could, in turn, subject us to additional regulatory scrutiny and impair our relationships with the investment community. The occurrence of any of these problems could negatively affect our reputation, financial condition and results of operations.
The lenders under our repurchase agreements may elect not to extend financing to us, which could quickly and seriously impair our liquidity.
We have historically financed a meaningful portion of our investments in securities and loans with repurchase agreements, which are short-term financing arrangements, and we may enter into additional repurchase agreements in the future. Under the terms of these agreements, we sell a security or loan to a counterparty for a specified price and concurrently agree to repurchase the same security or loan from our counterparty at a later date for a higher specified price. During the term of the repurchase agreement-generally 30 days-the counterparty makes funds available to us and holds the security or loan as collateral. Our counterparties can also require us to post additional margin as collateral at any time during the term of the agreement. When the term of a repurchase agreement ends, we are required to repurchase the security or loan for the specified repurchase price, with the difference between the sale and repurchase prices serving as the equivalent of paying interest to the counterparty in return for extending financing to us. If we want to continue to finance the security or loan with a repurchase agreement, we ask the counterparty to extend-or “roll”-the repurchase agreement for another term.
Our counterparties are not required to roll our repurchase agreements upon the expiration of their stated terms, which subjects us to a number of risks. As we have experienced in the past and may experience in the future, counterparties electing to roll our repurchase agreements may charge higher spreads and impose more onerous terms upon us, including the requirement that we post additional margin as collateral. More significantly, if a repurchase agreement counterparty elects not to extend our financing, we would be required to pay the counterparty the full repurchase price on the maturity date and find an alternate source of financing. Alternate sources of financing may be more expensive, contain more onerous terms or may not be available in a timely manner or at all. If we were unable to pay the repurchase price for any security or loan financed with a repurchase agreement, the counterparty has the right to sell the underlying security or loan being held as collateral and require us to compensate for any
shortfall between the value of our obligation to the counterparty and the amount for which the collateral was sold (which may be a significantly discounted price). As of December 31, 2016, we had $601.0 million outstanding face amount under repurchase agreement financings. These repurchase agreement obligations are with two counterparties.
Our determination of how much leverage to apply to our investments may adversely affect our return on our investments and may reduce cash available for distribution.
We leverage a meaningful portion of our portfolio through borrowings, generally through the use of credit facilities, warehouse facilities, repurchase agreements, mortgage loans on real estate, private or public offerings of debt by subsidiaries, loans to entities in which we hold, directly or indirectly, interests in pools of properties or loans, and other borrowings. Our investment policies do not limit the amount of leverage we may incur with respect to any specific asset or pool of assets, subject to an overall limit on our use of leverage to 90% (as defined in our governing documents) of the value of our assets on an aggregate basis. We cannot assure you that we will be able to sustain our liquidity position.
We are party to agreements that require cash payments upon the occurrence of certain events, and the failure to make such payments may adversely affect our business, financial condition and results of operations.
We are currently party to repurchase agreements that may require us to post additional margin as collateral at any time during the term of the agreement, based on the value of the collateral. We are currently and may become party to other types of financing agreements that require us to make cash payments at periodic intervals or upon the occurrence of certain events, including upon the conveyance of substantially all of our assets. Events could occur or circumstances could arise, which we may not be able to foresee, that may cause us to be unable to make any such cash payments when they become due. While we try to comply with all of our financing agreements, failure to make the payments required under our financing documents would give the lenders the right to require us to repay all amounts owed to them under the applicable financing immediately. In addition, differing interpretations of the terms of our financing agreements could give rise to disputes over compliance and would result in unanticipated prepayments of such debt or otherwise negatively affect our liquidity, financial position or results of operations.
We are subject to counterparty default and concentration risks.
In the ordinary course of our business, we enter into various types of financing arrangements with counterparties. Currently, the majority of our financing arrangements take the form of repurchase agreements, securitization vehicles, loans, hedge contracts and other derivative and non-derivative contracts. The terms of these contracts are often customized and complex, and many of these arrangements occur in markets or relate to products that are not subject to regulatory oversight.
We are subject to the risk that the counterparty to one or more of these contracts defaults, either voluntarily or involuntarily, on its performance under the contract. Any such counterparty default may occur rapidly and without notice to us. Moreover, if a counterparty defaults, we may be unable to take action to cover our exposure, either because we lack the contractual ability or because market conditions make it difficult to take effective action. This inability could occur in times of market stress, which are precisely the times when defaults may be most likely to occur.
In addition, our risk-management processes may not accurately anticipate the impact of market stress or counterparty financial condition, and as a result, we may not take sufficient action to reduce our risks effectively. Although we monitor our credit exposures, default risk may arise from events or circumstances that are difficult to detect, foresee or evaluate. In addition, concerns about, or a default by, one large participant could lead to significant liquidity problems for other participants, which may in turn expose us to significant losses.
In the event of a counterparty default, particularly a default by a major investment bank, we could incur material losses rapidly, and the resulting market impact of a major counterparty default could seriously harm our business, results of operations and financial condition. In the event that one of our counterparties becomes insolvent or files for bankruptcy, our ability to eventually recover any losses suffered as a result of that counterparty’s default may be limited by the liquidity of the counterparty or the applicable legal regime governing the bankruptcy proceeding.
The consolidation and elimination of counterparties has increased our counterparty concentration risk. We are not restricted from dealing with any particular counterparty or from concentrating any or all of our transactions with a few counterparties. If any of our counterparties elected not to roll these repurchase agreements, we may not be able to find a replacement counterparty. In addition, counterparties have generally tightened their underwriting standards and increased their margin requirements for financing, which has negatively impacted us in several ways, including, decreasing the number of counterparties willing to provide financing to us, decreasing the overall amount of leverage available to us, and increasing the costs of borrowing.
Any loss suffered by us as a result of a counterparty defaulting, refusing to conduct business with us or imposing more onerous terms on us would also negatively affect our business, results of operations and financial condition.
Our investments in debt securities are subject to specific risks relating to the particular issuer of the securities and to the general risks of investing in subordinated real estate securities.
Our investments in debt securities involve special risks. Our investments in debt are subject to the risks described above with respect to mortgage loans and mortgage- backed securities and similar risks, including:
| |
• | risks of delinquency and foreclosure, and risks of loss in the event thereof; |
| |
• | the dependence upon the successful operation of and net income from real property; |
| |
• | risks generally incident to interests in real property; and |
| |
• | risks that may be presented by the type and use of a particular property. |
Debt securities may be unsecured and may also be subordinated to other obligations of the issuer. We may also invest in debt securities that are rated below investment grade. As a result, investments in debt securities are also subject to risks of:
| |
• | limited liquidity in the secondary trading market; |
| |
• | substantial market price volatility resulting from changes in prevailing interest rates or credit spreads; |
| |
• | subordination to the prior claims of senior lenders to the issuer; |
| |
• | the possibility that earnings of the debt security issuer may be insufficient to meet its debt service; and |
| |
• | the declining creditworthiness and potential for insolvency of the issuer of such debt securities. |
These risks may adversely affect the value of outstanding debt securities and the ability of the issuers thereof to repay principal and interest.
Our investments in real estate related and other loans and other direct and indirect interests in pools of real estate properties or other loans may be subject to additional risks relating to the structure and terms of these transactions, which may result in losses to us.
We have investments in real estate related and other loans and other direct and indirect interests in pools of real estate properties or loans, such as mezzanine loans. We have invested in mezzanine loans that take the form of subordinated loans secured by second mortgages on the underlying real property or other business assets or revenue streams or loans secured by a pledge of the ownership interests of the entity owning real property or other business assets or revenue streams (or the ownership interest of the parent of such entity). These types of investments involve a higher degree of risk than long-term senior lending secured by business assets or income producing real property because the investment may become unsecured as a result of foreclosure by a senior lender. In the event of a bankruptcy of the entity providing the pledge of its ownership interests as security, we may not have full recourse to the assets of such entity, or the assets of the entity may not be sufficient to repay our mezzanine loan. If a borrower defaults on our mezzanine loan or debt senior to our loan, or in the event of a borrower bankruptcy, our mezzanine loan will be satisfied only after the senior debt is repaid in full. As a result, we may not recover some or all of our investment. In addition, mezzanine loans may have higher loan to value ratios than conventional mortgage loans, resulting in less equity in the property and increasing the risk of loss of principal.
Investment in non-investment grade loans may involve increased risk of loss.
We have acquired certain loans that do not conform to conventional loan criteria applied by traditional lenders and are not rated or are rated as non-investment grade (for example, for investments rated by Moody’s Investors Service, ratings lower than Baa3, and for Standard & Poor’s, BBB- or below). The non-investment grade ratings for these loans typically result from the overall leverage of the loans, the lack of a strong operating history for the properties or businesses underlying the loans, the borrowers’ credit history, the properties’ underlying cash flows or other factors. As a result, these loans have a higher risk of default and loss than conventional loans. Any loss we incur may reduce distributions to our stockholders. There are no limits on the percentage of unrated or non-investment grade assets we may hold in our portfolio.
Many of our investments are illiquid, and this lack of liquidity could significantly impede our ability to vary our portfolio in response to changes in economic and other conditions or to realize the value at which such investments are carried if we are required to dispose of them.
The real estate properties that we own and operate and our other direct and indirect investments in real estate, loans and securities are generally illiquid. In addition, the real estate securities that we purchase in connection with privately negotiated transactions are not registered under the relevant securities laws, resulting in a prohibition against their transfer, sale, pledge or other disposition except in a transaction that is exempt from the registration requirements of, or is otherwise in accordance with, those laws. In addition, there are no established trading markets for a majority of our investments. As a result, our ability to vary our portfolio in response to changes in economic and other conditions may be limited.
Our securities have historically been valued based primarily on third party quotations, which are subject to significant variability based on the liquidity and price transparency created by market trading activity. In the past, dislocation in the trading markets has reduced the trading for many real estate securities, resulting in less transparent prices for those securities. During such times, it is more difficult for us to sell many of our assets because, if we were to sell such assets, we would likely not have access to readily ascertainable market prices when establishing valuations of them. If we are required to liquidate all or a portion of our illiquid investments quickly, we may realize significantly less than the amount at which we have previously valued these investments.
Interest rate fluctuations and shifts in the yield curve may cause losses.
Interest rates are highly sensitive to many factors, including governmental monetary and tax policies, domestic and international economic and political considerations and other factors beyond our control. Our primary interest rate exposures relate to our real estate securities, loans, floating rate debt obligations and interest rate swaps. Changes in interest rates, including changes in expected interest rates or “yield curves,” affect our business in a number of ways. Changes in the general level of interest rates can affect our net interest income, which is the difference between the interest income earned on our interest-earning assets and the interest expense incurred in connection with our interest-bearing liabilities and hedges. Changes in the level of interest rates also can affect, among other things, our ability to acquire real estate securities and loans at attractive prices, the value of our real estate securities, loans and derivatives and our ability to realize gains from the sale of such assets. In the past, we have utilized hedging transactions to protect our positions from interest rate fluctuations, but as a result of market conditions we face significant obstacles to entering into new hedging transactions. As a result, we may not be able to protect new investments from interest rate fluctuations to the same degree as in the past, which could adversely affect our financial condition and results of operations. In the event of a significant rising interest rate environment and/or economic downturn, loan and collateral defaults may increase and result in credit losses that would adversely affect our liquidity and operating results.
Our ability to execute our business strategy, particularly the growth of our investment portfolio, depends to a significant degree on our ability to obtain additional capital. Our financing strategy for certain of our investments is dependent on our ability to place the match funded debt we use to finance our investments at rates that provide a positive net spread. If spreads for such liabilities widen or if demand for such liabilities ceases to exist, then our ability to execute future financings will be severely restricted.
Interest rate changes may also impact our net book value as our real estate securities, real estate related and other loans and hedge derivatives are marked to market each quarter. Debt obligations are not marked to market. Generally, as interest rates increase, the value of our fixed rate securities decreases, which will decrease the book value of our equity.
Furthermore, shifts in the U.S. Treasury yield curve reflecting an increase in interest rates would also affect the yield required on our real estate securities and therefore their value. For example, increasing interest rates would reduce the value of the fixed rate assets we hold at the time because the higher yields required by increased interest rates result in lower market prices on existing fixed rate assets in order to adjust the yield upward to meet the market, and vice versa. This would have similar effects on our real estate securities portfolio and our financial position and operations to a change in interest rates generally. In December 2016,
the U.S. Federal Reserve announced that it would raise short-term interest rates by a quarter percentage point to between 50 basis points and 75 basis points in the next year.
Our investments in debt securities and loans are subject to changes in credit spreads, which could adversely affect our ability to realize gains on the sale of such investments.
Debt securities and loans are subject to changes in credit spreads. Credit spreads measure the yield demanded on securities and loans by the market based on their credit relative to a specific benchmark.
Fixed rate securities and loans are valued based on a market credit spread over the rate payable on fixed rate U.S. Treasuries of like maturity. Floating rate securities and loans are valued based on a market credit spread over LIBOR and are affected similarly by changes in LIBOR spreads. Excessive supply of these securities combined with reduced demand will generally cause the market to require a higher yield on these securities and loans, resulting in the use of a higher, or “wider,” spread over the benchmark rate to value such securities. Under such conditions, the value of our debt securities and loan portfolios would tend to decline. Conversely, if the spread used to value such securities were to decrease, or “tighten,” the value of our debt securities portfolio would tend to increase. Such changes in the market value of our debt securities and loan portfolios may affect our net equity, net income or cash flows directly through their impact on unrealized gains or losses on available-for-sale securities, and therefore our ability to realize gains on such securities, or indirectly through their impact on our ability to borrow and access capital. During 2008 through the first quarter of 2009, credit spreads widened substantially. This widening of credit spreads caused the net unrealized gains on our securities, loans and derivatives, recorded in accumulated other comprehensive income or retained earnings, and therefore our book value per share, to decrease and resulted in net losses.
In addition, if the value of our loans subject to financing agreements were to decline, it could affect our ability to refinance such loans upon the maturity of the related repurchase agreements. Any credit or spread related losses incurred with respect to our loans would affect us in the same way as similar losses on our real estate securities portfolio as described above.
Under certain conditions, increases in prepayment rates can adversely affect yields on many of our investments.
The value of many of the assets in which we invest may be affected by prepayment rates on these assets. Prepayment rates are influenced by changes in current interest rates and a variety of economic, geographic and other factors beyond our control, and consequently, prepayment rates cannot be predicted with certainty. In periods of declining mortgage interest rates, prepayments on loans generally increase. If general interest rates decline as well, the proceeds of such prepayments received during such periods are likely to be reinvested by us in assets yielding less than the yields on the assets that were prepaid. In addition, the market value of floating rate assets may, because of the risk of prepayment, benefit less than fixed rate assets from declining interest rates. Conversely, in periods of rising interest rates, prepayments on loans generally decrease, in which case we would not have the prepayment proceeds available to invest in assets with higher yields. Under certain interest rate and prepayment scenarios we may fail to recoup fully our cost of acquisition of certain investments.
We are actively exploring new business opportunities and asset categories, which could entail a meaningful change in our investment focus and operations and pose significant risks to our financial condition, results of operations and liquidity.
Consistent with our broad investment guidelines and our investment objectives, we have acquired and/or are pursuing a variety of assets that differ from the assets in our legacy portfolio, such as a Traditional Golf business (which we acquired in December 2013), excess mortgage servicing rights (“Excess MSRs”) (which we spun-off in May 2013), media assets (which we spun-off in February 2014) and senior housing properties (which we spun-off in November 2014). Although we currently believe that we will have significant investment opportunities in the future, these opportunities may not materialize. In addition, our ability to act on new investment opportunities may be constrained by the requirements of the Investment Company Act of 1940, as amended (the “1940 Act”), or federal tax law. See “–Risks Related to Our Tax Status and the 1940 Act.”
New investments may not be profitable (or as profitable as we expect), may increase our exposure to certain industries (such as the lodging, gaming and leisure industry), may increase our exposure to interest rate, foreign currency, real estate market or credit market fluctuations, may divert managerial attention from more profitable opportunities, and may require significant financial and other resources. A change in our investment strategy may also increase our use of non-match-funded financing, increase the guarantee obligations we agree to incur or increase the number of transactions we enter into with affiliates. Moreover, new investments may present risks that are difficult for us to adequately assess, given our lack of familiarity with a particular industry, asset class or other reasons. The risks related to new asset categories or the financing risks associated with such assets could adversely affect our results of operations, financial condition and liquidity, and could impair our ability to pay dividends on both our common stock and preferred stock. In addition, our ability to invest in or finance new investments, including our Traditional
Golf business, may be dependent upon our ability to monetize our real estate debt portfolio. See “-Risks Related to Our Manager-Our directors have approved very broad investment guidelines for our Manager, and we are not required to obtain stockholder consent to change our investment strategy or asset portfolio.”
Changes in accounting rules could occur at any time and could impact us in significantly negative ways that we are unable to predict or protect against.
As has been widely publicized, the SEC, the Financial Accounting Standards Board and other regulatory bodies that establish the accounting rules applicable to us have recently proposed or enacted a wide array of changes to accounting rules. Moreover, in the future these regulators may propose additional changes that we do not currently anticipate. Changes to accounting rules that apply to us could significantly impact our business or our reported financial performance in negative ways that we cannot predict or protect against. We cannot predict whether any changes to current accounting rules will occur or what impact any codified changes will have on our business, results of operations, liquidity or financial condition.
Failure to maintain effective internal control over financial reporting in accordance with Section 404 of the Sarbanes-Oxley Act could have a material adverse effect on our business and stock price.
As a public company, we are required to maintain effective internal control over financial reporting in accordance with Section 404 of the Sarbanes-Oxley Act of 2002. Internal control over financial reporting is complex and may be revised over time to adapt to changes in our business, or changes in applicable accounting rules. In connection with new investments, we may be required to consolidate additional entities, and, therefore, to document and test effective internal controls over the financial reporting of these entities in accordance with Section 404, which we may not be able to do. Even if we are able to do so, there could be significant costs and delays, particularly if these entities were not subject to Section 404 prior to being acquired by us. Under certain circumstances, the SEC permits newly acquired businesses to be excluded for a limited period of time from management’s annual assessment of the effectiveness of internal control. Our management identified a material weakness in our internal controls with respect to our financial statements for the year ended December 31, 2011. Although this was remediated, we cannot assure you that our internal control over financial reporting will be effective in the future or that a material weakness will not be discovered with respect to a prior period for which we believe that internal controls were effective. If we are not able to maintain or document effective internal control over financial reporting, our independent registered public accounting firm may not be able to certify as to the effectiveness of our internal control over financial reporting as of the required dates. Matters impacting our internal controls may cause us to be unable to report our financial information on a timely basis, or may cause us to restate previously issued financial information, and thereby subject us to adverse regulatory consequences, including sanctions or investigations by the SEC, or violations of applicable stock exchange listing rules. There could also be a negative reaction in the financial markets due to a loss of investor confidence in us and the reliability of our financial statements. Confidence in the reliability of our financial statements is also likely to suffer if we or our independent registered public accounting firm reports a material weakness in our internal control over financial reporting. This could materially adversely affect us by, for example, leading to a decline in our share price and impairing our ability to raise capital.
Our agreements with New Residential and New Senior may not reflect terms that would have resulted from negotiations among unaffiliated third parties, and we have agreed to indemnify New Residential and New Senior for certain liabilities in connection with their respective spin-offs.
We completed the spin-off of New Residential in May 2013. The terms of the agreements related to the spin-off of New Residential, including a separation and distribution agreement dated April 26, 2013 (the “NRZ Separation and Distribution Agreement”) between us and New Residential and a management agreement between our Manager and New Residential, were not negotiated among unaffiliated third parties. Such terms were proposed by our officers and other employees of our Manager and approved by our board of directors. As a result, these terms may be less favorable to us than the terms that would have resulted from negotiations among unaffiliated third parties.
In the NRZ Separation and Distribution Agreement, we have agreed to indemnify New Residential and its affiliates and representatives against losses arising from: (a) any liability related to our junior subordinated notes due 2035; (b) any other liability that has not been defined as a liability of New Residential; (c) any failure by us and our subsidiaries (other than New Residential and its subsidiaries) (collectively, the “Newcastle Group”) to pay, perform or otherwise promptly discharge any liability listed under (a) and (b) above in accordance with their respective terms, whether prior to, at or after the time of effectiveness of the NRZ Separation and Distribution Agreement; (d) any breach by any member of the Newcastle Group of any provision of the NRZ Separation and Distribution Agreement and any agreements ancillary thereto (if any), subject to any limitations of liability provisions and other provisions applicable to any such breach set forth therein; and (e) any untrue statement or alleged untrue statement of a material fact or omission or alleged omission to state a material fact required to be stated therein or necessary to
make the statements therein not misleading, with respect to all information contained in the information statement or the registration statement of which the information statement is a part that relates solely to any assets owned, directly or indirectly by us, other than New Residential’s initial portfolio of assets. Any indemnification payments that we may be required to make could have a significantly negative effect on our liquidity and results of operations.
We completed the spin-off of New Senior in November 2014. The terms of the separation and distribution agreement dated October 16, 2014 between us and New Senior are substantially similar to the terms of the NRZ Separation and Distribution Agreement, and therefore subjects us to similar risks.
Risks Related to Our Manager
We are dependent on our Manager and may not find a suitable replacement if our Manager terminates the management agreement.
None of our officers or other senior employees who perform services for us is an employee of the Company. Instead, these individuals are employees of our Manager. Accordingly, we are completely reliant on our Manager, which has significant discretion as to the implementation of our operating policies and strategies, to conduct our business. Furthermore, we are dependent on the services of certain key employees of our Manager whose compensation is partially dependent upon the amount of incentive or management compensation earned by our Manager and whose continued service is not guaranteed, and the loss of such services could adversely affect our operations. We are subject to the risk that our Manager will terminate the management agreement and that we will not be able to find a suitable replacement for our Manager in a timely manner, at a reasonable cost or at all. We may also be adversely affected by operational risks, including cyber security attacks, that could disrupt our Manager’s financial, accounting and other data processing systems.
On February 14, 2017, Fortress announced that it had entered into the Merger Agreement with SB Foundation Holdings LP, a Cayman Islands exempted limited partnership (“Parent”) and an affiliate of SoftBank, and Foundation Acquisition LLC, a Delaware limited liability company and wholly owned subsidiary of Parent (“Merger Sub”), pursuant to which Merger Sub will merge with and into Fortress, with Fortress surviving as a wholly owned subsidiary of Parent. While Fortress’s senior investment professionals are expected to remain in place, including those individuals who perform services for us, there can be no assurance that the Merger will not have an impact on us or our relationship with the Manager.
There are conflicts of interest in our relationship with our Manager.
There are conflicts of interest inherent in our relationship with our Manager. Actual, potential or perceived conflicts have given, and may in the future give, rise to investor dissatisfaction, litigation or regulatory inquiries or enforcement actions. Appropriately dealing with conflicts of interest is complex and difficult, and our reputation could be damaged if we fail, or appear to fail, to deal appropriately with one or more potential, actual or perceived conflicts of interest. Regulatory scrutiny of, or litigation in connection with, conflicts of interest could have a material adverse effect on our reputation, which could materially adversely affect our business in a number of ways, including causing an inability to raise additional funds, a reluctance of counterparties to do business with us, a decrease in the prices of our common and preferred securities and a resulting increased risk of litigation and regulatory enforcement actions.
Our management agreement with our Manager was not negotiated between unaffiliated parties, and its terms, including fees payable, although approved by our independent directors as fair, may not be as favorable to us as if they had been negotiated with an unaffiliated third party. Our management agreement, as amended, does not limit or restrict our Manager or its affiliates from engaging in any business or managing other pooled investment vehicles that make investments that meet our investment objectives. Entities managed by our Manager or its affiliates–including investment funds, private investment funds, or businesses managed by our Manager–have investment objectives that overlap with our investment objectives. Certain investments appropriate for us may also be appropriate for one or more of these other investment vehicles. These entities may invest in assets that meet our investment objectives, including real estate securities, real estate related and other loans, and other operating real estate, and other assets. Our Manager or its affiliates may have investments in and/or earn fees from such other investment vehicles that are higher than their economic interests in us and which may therefore create an incentive to allocate investments to such other investment vehicles. Our Manager or its affiliates may determine, in their discretion, to make a particular investment through an investment vehicle other than us and have no obligation to offer to us the opportunity to participate in any particular investment opportunity.
Our chairman is an officer of our Manager. Certain employees of our Manager who perform services for us also perform services for companies and funds that compete with us. These employees may serve as officers and/or directors of these other entities. The ability of our Manager and its officers and employees to engage in other business activities may reduce the
amount of time our Manager, its officers or other employees spend managing us.
In addition, we have engaged or may engage (subject to our investment guidelines) in material transactions with our Manager or an entity managed by our Manager or one of its affiliates, including, but not limited to, certain financing arrangements, purchases of debt and co-investments, that present an actual, potential or perceived conflict of interest. We may invest in portfolio companies of private equity funds managed by our Manager (or an affiliate thereof). We currently have debt investments in a portfolio company of private equity funds managed by our Manager (or an affiliate thereof). All investments, including investments in or involving affiliates or portfolio companies of affiliates are subject to an array of risks, including the risk that the investment is ultimately less profitable than the prior estimates or not profitable at all.
Our management agreement, as amended, does not limit or restrict our Manager or its affiliates from engaging in any business or managing other pooled investment vehicles that make investments that meet our investment objectives. Our Manager or its affiliates have and may in the future raise, acquire or manage investment vehicles that are entitled to a priority or exclusive right to invest in certain types of assets. If such an investment vehicle exists, that vehicle’s exclusivity would prevent us from investing in the assets over which the investment vehicle has exclusivity because we do not have the exclusive right to invest in any particular type of asset. This dynamic may reduce the type of assets in which we are able to invest.
The management compensation structure that we have agreed to with our Manager, as well as compensation arrangements that we may enter into with our Manager in the future (in connection with new lines of business or other activities), may incentivize our Manager to invest in high risk investments or to pursue separation transactions, such as the spin-offs of New Residential Investment Corp. (“New Residential”), New Media Investment Group Inc. (“New Media”) and New Senior Investment Group Inc. (“New Senior”). See “–Risks Related to Our Business–Our agreements with New Residential and New Senior may not reflect terms that would have resulted from arm’s-length negotiations among unaffiliated third parties, and we have agreed to indemnify New Residential and New Senior for certain liabilities.” In addition to its management fee, our Manager is entitled to receive incentive compensation based in part upon our achievement of targeted levels of funds from operations (as defined in the management agreement). In evaluating investments and other management strategies, the opportunity to earn incentive compensation based on funds from operations or, in the case of any future incentive compensation arrangement, other financial measures on which incentive compensation may be based, may lead our Manager to place undue emphasis on the maximization of such measures at the expense of other criteria, such as preservation of capital, in order to achieve higher incentive compensation, particularly in light of the fact that our Manager has not received any incentive compensation from us since 2008. Investments with higher yield potential are generally riskier or more speculative than lower-yielding investments.
Our Manager is eligible to receive compensation in the form of options in connection with the completion of our common equity offerings. Therefore, our Manager may be incentivized to cause us to issue additional common stock, which could be dilutive to existing stockholders. On April 7, 2016, our board of directors adopted the 2016 Newcastle Investment Corp. Nonqualified Option and Incentive Award Plan (the “2016 Plan”), which our stockholders approved at our 2016 Annual Meeting of Stockholders and provides for 300,000 shares of our common stock to be available for grants of equity awards thereunder, as increased on the date of any equity issuance by us during the one-year term of the 2016 Plan by ten percent of the equity securities issued by us in such equity issuance. In addition to the shares available for issuance under the 2012 Newcastle Nonqualified Stock Option and Incentive Plan, the 2014 Newcastle Nonqualified Stock Option and Incentive Plan, the 2015 Newcastle Nonqualified Option and Incentive Award Plan, and the 2016 Plan or any successor plan thereto (collectively, the “Option Plans”), our board of directors may also determine to grant options to our Manager that are not issued pursuant to the Option Plans, provided that the number of shares underlying any options granted to our Manager in connection with any capital raising efforts will not exceed 10% of the shares sold in such offering and would be subject to NYSE rules.
It would be difficult and costly to terminate our management agreement with our Manager.
It would be difficult and costly for us to terminate our management agreement with our Manager. The management agreement may only be terminated annually upon (i) the affirmative vote of at least two-thirds of our independent directors, or by a vote of the holders of a simple majority of the outstanding shares of our common stock, that there has been unsatisfactory performance by our Manager that is materially detrimental to us or (ii) a determination by a simple majority of our independent directors that the management fee payable to our Manager is not fair, subject to our Manager’s right to prevent such a termination by accepting a mutually acceptable reduction of fees. Our Manager will be provided 60 days’ prior notice of any such termination and will be paid a termination fee equal to the amount of the management fee earned by the Manager during the 12-month period preceding such termination. In addition, following any termination of the management agreement, the Manager may require us to purchase its right to receive incentive compensation at a price determined as if our assets were sold for their fair market value (as determined by an appraisal, taking into account, among other things, the expected future value of the underlying investments) or otherwise we may continue to pay the incentive compensation to our Manager. These provisions may increase the effective cost to us of
terminating the management agreement, thereby adversely affecting our ability to terminate our Manager without cause.
Our directors have approved very broad investment guidelines for our Manager, and we are not required to obtain stockholder consent to change our investment strategy or asset portfolio.
Our Manager is authorized to follow very broad investment guidelines, and our directors do not approve each investment decision made by our Manager. Our investment guidelines are purposefully broad to enable our Manager to make investments in a wide array of assets. Our Manager’s investment decisions are based on a variety of factors, such as changing market conditions, perceived investment opportunities and available capital. Investment opportunities that present unattractive risk-return profiles relative to other available investment opportunities under particular market conditions may become relatively attractive under changed market conditions, and changes in market conditions may therefore result in changes in the investments we target. We do not have policies requiring the allocation of equity to different investment categories, although our investment guidelines do restrict investments of more than 20% of our total equity (as determined on the date of such investment) in any single asset. Consequently, our Manager has great latitude in determining which investments are appropriate for us, including the latitude to build concentrations in certain positions and to invest in asset classes that may differ significantly from those in our existing portfolio. Our directors periodically review our investment guidelines and our investment portfolio. However, our directors rely primarily on information provided to them by our Manager, and they do not review or pre-approve each proposed investment or the related financing arrangements. A transaction entered into by our Manager that contravenes the terms of our management agreement may be difficult or impossible to unwind by the time it is reviewed by our directors. In addition, we are not required to obtain stockholder consent in order to change our investment strategy and asset portfolio, which may result in making investments that are different, riskier or less profitable than our current investments.
Our investment strategy and asset portfolio have undergone meaningful changes in recent years through spin-offs and other strategic transactions and will continue to evolve in light of existing market conditions and investment opportunities. See “-Risks Related to Our Business-We are actively exploring new business opportunities and asset categories, which could entail a meaningful change in our investment focus and operations and pose significant risks to our financial condition, results of operations and liquidity.”
Our Manager will not be liable to us for any acts or omissions performed in accordance with the management agreement, including with respect to the performance of our investments.
Pursuant to our management agreement, our Manager will not assume any responsibility other than to render the services called for thereunder and will not be responsible for any action of our board of directors in following or declining to follow its advice or recommendations. Under the terms of our management agreement, our Manager, its officers, partners, members, managers, directors, personnel, other agents, any person controlling or controlled by our Manager and any person providing sub-advisory services to our Manager will not be liable to us, any subsidiary of ours, our directors, our stockholders or any subsidiary’s stockholders or partners for acts or omissions performed in accordance with and pursuant to our management agreement, except because of acts constituting bad faith, willful misconduct or gross negligence, as determined by a final non-appealable order of a court of competent jurisdiction. In addition, we have agreed to indemnify our Manager, its officers, partners, members, managers, directors, personnel, other agents, any person controlling or controlled by our Manager and any person providing sub-advisory services to our Manager with respect to all expenses, losses, damages, liabilities, demands, charges and claims arising from acts of our Manager not constituting bad faith, willful misconduct or gross negligence, pursuant to our management agreement.
Our Manager’s due diligence of investment opportunities or other transactions may not identify all pertinent risks, which could materially affect our business, financial condition, liquidity and results of operations.
Our Manager intends to conduct due diligence with respect to each investment opportunity or other transaction it pursues. It is possible, however, that our Manager’s due diligence processes will not uncover all relevant facts, particularly with respect to any assets we acquire from third parties. In these cases, our Manager may be given limited access to information about the investment and will rely on information provided by the target of the investment. In addition, if investment opportunities are scarce, the process for selecting bidders is competitive, or the time-frame in which we are required to complete diligence is short, our ability to conduct a due diligence investigation may be limited, and we would be required to make investment decisions based upon a less thorough diligence process than would otherwise be the case. Accordingly, investments and other transactions that initially appear to be viable may prove not to be over time due to the limitations of the due diligence process or other factors.
Risks Related to Our Common Stock
Our stock price has fluctuated meaningfully, particularly on a percentage basis, and may fluctuate meaningfully in the future. Accordingly, you may not be able to resell your shares at or above the price at which you purchased them.
The trading price of our common stock has fluctuated significantly in the past. The trading price of our common stock could fluctuate significantly in the future and could be negatively affected in response to various factors, including:
| |
• | market conditions in the broader stock market in general, or in the real estate or golf industries in particular; |
| |
• | our ability to make investments with attractive risk-adjusted returns; |
| |
• | market perception of our current and projected financial condition, potential growth, future earnings and future cash dividends; |
| |
• | announcements we make regarding dividends; |
| |
• | actual or anticipated fluctuations in our quarterly financial and operating results; |
| |
• | market perception or media coverage of our Manager or its affiliates; |
| |
• | additional offerings of our common stock; |
| |
• | actions by rating agencies; |
| |
• | short sales of our common stock; |
| |
• | any decision to pursue a distribution or disposition of a meaningful portion of our assets; |
| |
• | issuance of new or changed securities analysts’ reports or recommendations; |
| |
• | media coverage of us, or the outlook of the real estate and golf industries; |
| |
• | major reductions in trading volumes on the exchanges on which we operate; |
| |
• | credit deterioration within our portfolio; |
| |
• | legislative or regulatory developments, including changes in the status of our regulatory approvals or licenses; |
| |
• | litigation and governmental investigations; and |
| |
• | any decision to pursue a spin-off of a portion of our assets. |
These and other factors may cause the market price and demand for our common stock to fluctuate substantially, which may negatively affect the price or liquidity of our common stock. When the market price of a stock has been volatile or has decreased significantly in the past, holders of that stock have, at times, instituted securities class action litigation against the company that issued the stock. If any of our stockholders brought a lawsuit against us, we could incur substantial costs defending, settling or paying any resulting judgments related to the lawsuit. Such a lawsuit could also divert the time and attention of our management from our business and hurt our share price.
We may be unable-or elect not-to pay dividends on our common or preferred stock in the future, which would negatively impact our business in a number of ways and decrease the price of our common and preferred stock.
Prior to termination of our REIT election, we made distributions of a minimum of 90% of our taxable income each year in order to maintain our REIT status. As a result of the revocation of our REIT election, effective January 1, 2017, we are no longer required by the REIT rules to make distributions of substantially all of our net taxable income. Our board of directors elected not to pay a common stock dividend in the first quarter of 2017 to retain capital for growth. All future dividend distributions will be made at
the discretion of our board of directors and will depend upon, among other things, our earnings, investment strategy, financial condition and liquidity, and such other factors as the board of directors deems relevant. No assurance can be given that we will pay any dividends on our common stock in the future.
We do not currently have unpaid accrued dividends on our preferred stock. However, to the extent we do, we cannot pay any dividends on our common stock, pay any consideration to repurchase or otherwise acquire shares of our common stock or redeem any shares of any series of our preferred stock without redeeming all of our outstanding preferred shares in accordance with the governing documentation. Consequently, the failure to pay dividends on our preferred stock restricts the actions that we may take with respect to our common stock and preferred stock. Moreover, if we do not pay dividends on any series of preferred stock for six or more periods, then holders of each affected series obtain the right to call a special meeting and elect two members to our board of directors. We cannot predict whether the holders of our preferred stock would take such action or, if taken, how long the process would take or what impact the two new directors on our board of directors would have on our company (other than increasing our director compensation costs). However, the election of additional directors would affect the composition of our board of directors and, thus, could affect the management of our business.
Shares eligible for future sale may adversely affect our common stock price.
Sales of our common stock or other securities in the public or private market, or the perception that these sales may occur, could cause the market price of our common stock to decline. This could also impair our ability to raise additional capital through the sale of our equity securities. Under our certificate of incorporation, we are authorized to issue up to 1,000,000,000 shares of common stock and we are authorized to reclassify a portion of our authorized preferred stock into common stock, and there were 66,842,378 shares or our common stock outstanding as of February 22, 2017. We cannot predict the size of future issuances of our common stock or other securities or the effect, if any, that future sales and issuances would have on the market price of our common stock.
An increase in market interest rates may have an adverse effect on the market price of our common stock.
One of the factors that investors may consider in deciding whether to buy or sell shares of our common stock is our distribution rate as a percentage of our share price relative to market interest rates. If the market price of our common stock is based primarily on the earnings and return that we derive from our investments and income with respect to our investments and our related distributions to stockholders, and not from the market value of the investments themselves, then interest rate fluctuations and capital market conditions will likely affect the market price of our common stock. For instance, if market interest rates rise without an increase in our distribution rate, the market price of our common stock could decrease as potential investors may require a higher distribution yield on our common stock or seek other securities paying higher distributions or interest. In addition, rising interest rates would result in increased interest expense on our variable rate debt, thereby adversely affecting cash flows and our ability to service our indebtedness and pay distributions.
ERISA may restrict investments by plans in our common stock.
A plan fiduciary considering an investment in our common stock should consider, among other things, whether such an investment is consistent with the fiduciary obligations under the Employee Retirement Income Security Act of 1974, as amended (“ERISA”), including whether such investment might constitute or give rise to a prohibited transaction under ERISA, the Code or any substantially similar federal, state or local law and, if so, whether an exemption from such prohibited transaction rules is available.
Maryland takeover statutes may prevent a change of our control, which could depress our stock price.
Under Maryland law, “business combinations” between a Maryland corporation and an interested stockholder or an affiliate of an interested stockholder are prohibited for five years after the most recent date on which the interested stockholder becomes an interested stockholder. These business combinations include certain mergers, consolidations, share exchanges, or, in circumstances specified in the statute, an asset transfer or issuance or reclassification of equity securities or a liquidation or dissolution. An interested stockholder is defined as:
| |
• | any person who beneficially owns 10% or more of the voting power of the corporation’s outstanding shares; or |
| |
• | an affiliate or associate of a corporation who, at any time within the two-year period prior to the date in question, was the beneficial owner of 10% or more of the voting power of the then outstanding stock of the corporation. |
| |
• | A person is not an interested stockholder under the statute if the board of directors approved in advance the transaction |
by which he or she otherwise would have become an interested stockholder.
| |
• | After the five-year prohibition, any business combination between the Maryland corporation and an interested stockholder generally must be recommended by the board of directors of the corporation and approved by the affirmative vote of at least: |
| |
• | 80% of the votes entitled to be cast by holders of outstanding shares of voting stock of the corporation voting together as a single group; and |
| |
• | two-thirds of the votes entitled to be cast by holders of voting stock of the corporation other than shares held by the interested stockholder with whom or with whose affiliate the business combination is to be effected or held by an affiliate or associate of the interested stockholder voting together as a single voting group. |
The business combination statute may discourage others from trying to acquire control of us and increase the difficulty of consummating any offer, including potential acquisitions that might involve a premium price for our common stock or otherwise be in the best interest of our stockholders.
Our staggered board and other provisions of our charter and bylaws may prevent a change in our control.
Our board of directors is divided into three classes of directors. Directors of each class are chosen for three-year terms upon the expiration of their current terms, and each year one class of directors is elected by the stockholders. The staggered terms of our directors may reduce the possibility of a tender offer or an attempt at a change in control, even though a tender offer or change in control might be in the best interest of our stockholders. In addition, our charter and bylaws also contain other provisions that may delay or prevent a transaction or a change in control that might involve a premium price for our common stock or otherwise be in the best interest of our stockholders.
Our charter authorizes us to issue additional authorized but unissued shares of our common stock or preferred stock. In addition, our board of directors may classify or reclassify any unissued shares of our common stock or preferred stock and may set the preferences, rights and other terms of the classified or reclassified shares. As a result, our board of directors may establish a series of preferred stock that could delay or prevent a transaction or a change in control that might involve a premium price for our common stock or otherwise be in the best interest of our stockholders.
Risks Related to Our Tax Status and the 1940 Act
We no longer qualify for taxation as a REIT for U.S. federal income tax purposes effective as of January 1, 2017, and there can be no assurance that the IRS will not challenge our previous REIT status.
Although we elected for U.S. federal income tax purposes to be treated as a REIT for the 2016 taxable year and in prior taxable years, we revoked our REIT election for the tax year beginning January 1, 2017 and intend to be treated as a regular “C corporation” for that year and any year in the foreseeable future, and, as a result, we will be unable to claim the United States federal income tax benefits associated with REIT status. Moreover, there can be no assurance that the IRS will not challenge our qualification as a REIT for years in which we intended to qualify as a REIT. Although we believe we did qualify as a REIT in each such year, if the IRS were to successfully challenge our previous REIT status, we would suffer adverse tax consequences, such as those described below.
For the 2017 taxable year and future years (and for any prior year if we were to fail to qualify as a REIT in such year), we will generally be subject to federal income tax, including any applicable alternative minimum tax, on our taxable income at regular corporate rates, and distributions to stockholders would not be deductible by us in computing our taxable income. Any such corporate tax liability could be substantial and would reduce the amount of cash available for distribution to our stockholders, which in turn could have an adverse impact on the value of, and trading prices for, our stock. Our decision to revoke our REIT election could also have other effects on any given stockholder, depending on its particular circumstances. For example, certain foreign investors that own large positions in our stock may be subject to less favorable rules under the Foreign Investment in Real Property Tax Act of 1980 following the revocation of our REIT election. Stockholders are urged consult their tax advisors regarding the effects to them of the revocation of our REIT elections in light of their particular circumstances.
Our board of directors’ decision to revoke our REIT election means we will no longer be required to distribute substantially all of our net taxable income to our stockholders.
Prior to termination of our REIT election, we made distributions of a minimum of 90% of our taxable income each year in order to maintain our REIT status. On February 23, 2017, we revoked our election to be treated as a REIT, effective January 1, 2017. Consequently, we are no longer subject to the distribution requirements applicable to REITs. Our board of directors elected not to pay a common stock dividend in the first quarter of 2017 to retain capital for growth. All future dividend distributions will be made at the discretion of our board of directors and will depend upon, among other things, our earnings, investment strategy, financial condition and liquidity, and such other factors as the board of directors deems relevant, as well as any contractual restrictions.
In January 2013, we experienced an “ownership change” for purposes of Section 382 of the Code, which limits our ability to utilize our net operating loss and net capital loss carryforwards and certain built-in losses to reduce our future taxable income, potentially increases the net taxable income on which we must pay corporate-level taxes, and potentially adversely affects our liquidity, and we could experience another ownership change in the future or forgo otherwise attractive opportunities in order to avoid experiencing another ownership change.
As a result of our January 2013 “ownership change,” our future ability to utilize our net operating loss and net capital loss carryforwards to reduce our taxable income may be limited by certain provisions of the Code.
Specifically, the Code limits the ability of a company that undergoes an “ownership change” to utilize its net operating loss and net capital loss carryforwards and certain built-in losses to offset taxable income earned in years after the ownership change. An ownership change occurs if, during a three-year testing period, more than 50% of the stock of a company is acquired by one or more persons (or certain groups of persons) who own, directly or constructively, 5% or more of the stock of such company. An ownership change can occur as a result of a public offering of stock, as well as through secondary market purchases of our stock and certain types of reorganization transactions. Generally, when an ownership change occurs, the annual limitation on the use of net operating loss and net capital loss carryforwards and certain built-in losses is equal to the product of the applicable long-term tax exempt rate and the value of the company’s stock immediately before the ownership change. We have substantial net operating and net capital loss carry forwards which we have used, and will continue to use, to offset our taxable income. In January 2013, an “ownership change” for purposes of Section 382 of the Code occurred. Therefore, the provisions of Section 382 of the Code impose an annual limit on the amount of net operating loss and net capital loss carryforwards and built in losses that we can use to offset future taxable income.
The ownership change we experienced in January 2013 (and any subsequent ownership changes) could materially increase our income tax liability. As described above, the ownership change we experienced in January resulted in a limitation on our use of net operating losses and net capital loss carryforwards. These limitations could result in us incurring materially greater tax liability than if we had not undergone such an ownership change.
In addition, if we were to undergo an ownership change again in the future, our net operating losses and net capital loss carryforwards could become subject to additional limitations, which could result in us incurring materially greater tax liability than if we had not undergone such an ownership change. The determination of whether an ownership change has occurred or will occur is complicated and depends on changes in percentage stock ownership among stockholders. We adopted the Tax Benefits Preservation Plan described below in order to discourage an ownership change. However, there can be no assurance that the Tax Benefits Preservation Plan will prevent an ownership change. In addition, to the extent not prohibited by our charter, we may decide in the future that it is necessary or in our interest to take certain actions that could result in an ownership change. Therefore, no assurance can be provided as to whether an ownership change has occurred or will occur in the future.
Moreover, the potential negative consequences of the limitations that would result from an ownership change may discourage us from, among other things, redeeming our stock or issuing additional common stock to raise capital or to acquire businesses or assets. Accordingly, our desire to preserve our net operating losses and net capital loss carryforwards may cause us to forgo otherwise attractive opportunities.
Our Tax Benefits Preservation Plan could inhibit a change in our control that may otherwise be favorable to our stockholders.
In December 2016, our board of directors adopted a Tax Benefits Preservation Plan in an effort to protect against a possible limitation on our ability to use our net operating losses and net capital loss carryforwards by discouraging investors from acquiring ownership of our common stock in a manner that could trigger an “ownership change” for purposes of Sections 382 and 383 of the Code. Under the terms of the Tax Benefits Preservation Plan, in general, if a person or group acquires beneficial ownership
of 4.9% or more of the outstanding shares of our Common Stock without prior approval of our board of directors or without meeting certain exceptions (an “Acquiring Person”), the rights would become exercisable and our stockholders (other than the Acquiring Person) will have the right to purchase securities from us at a discount to such securities’ fair market value, thus causing substantial dilution to the Acquiring Person. As a result, the Tax Benefits Preservation Plan may have the effect of inhibiting or impeding a change in control not approved by our board of directors and, notwithstanding its purpose, could adversely affect our shareholders’ ability to realize a premium over the then-prevailing market price for our common stock in connection with such a transaction. In addition, because our board of directors may consent to certain transactions, the Tax Benefits Preservation Plan gives our board of directors significant discretion over whether a potential acquirer’s efforts to acquire a large interest in us will be successful. There can be no assurance that the Tax Benefits Preservation Plan will prevent an “ownership change” within the meaning of Sections 382 and 383 of the Code, in which case we may lose all or most of the anticipated tax benefits associated with our prior losses.
Qualifying as a REIT involves highly technical and complex provisions of the Code, and our failure to qualify as a REIT for any taxable year through 2016 would result in higher taxes and reduced cash available for distribution to our stockholders.
As described above, we operated through December 31, 2016 in a manner intended to qualify us as a REIT for federal income tax purposes. Qualification as a REIT involves the application of highly technical and complex Code provisions for which only limited judicial and administrative authorities exist. Even a technical or inadvertent violation could jeopardize our REIT qualification for such taxable years. Our qualification as a REIT depended on our satisfaction of certain asset, income, organizational, distribution, stockholder ownership and other requirements. Although we believe we satisfied those requirements, no assurance can be given in that regard.
Our failure to qualify as a REIT for a taxable year ending on or before December 31, 2015, would potentially give rise to a claim for damages from New Residential or New Senior.
In connection with the spin-off of New Residential, which was completed in May 2013, and the spin-off of New Senior, which was completed in November 2014, we represented in the Separation Agreements that we had no knowledge of any fact or circumstance that would cause us to fail to qualify as a REIT. We also covenanted in the Separation Agreements to generally use our reasonable best efforts to maintain our REIT status for each of our taxable years ending on or before December 31, 2014 (in the case of New Residential) and December 31, 2015 (in the case of New Senior). If, notwithstanding our belief that we qualified as a REIT for such taxable years, we breached this representation or covenant, New Residential or New Senior, or both, could be able to seek damages from us, which could have a significantly negative effect on our liquidity and results of operations.
If New Residential failed to qualify as a REIT for 2013, or if New Senior failed to qualify as a REIT for 2014, it would significantly affect our ability to maintain our REIT status through December 31, 2016.
For federal income tax purposes we recorded approximately $600 million of gain as a result of the spin-off of New Residential in May 2013 and $450 million of gain as a result of the spin-off of New Senior in November 2014. If New Residential qualified for taxation as a REIT for 2013, and if New Senior so qualified for 2014, that gain is qualifying income for purposes of our REIT income tests in such years. If, however, New Residential failed to qualify as a REIT for 2013, or if New Senior failed to so qualify in 2014, that gain would be non-qualifying income for purposes of the 75% gross income test. Although New Residential and New Senior covenanted in their respective separation and distribution agreements to use reasonable best efforts to qualify as a REIT in 2013 and 2014, respectively, no assurance can be given that they so qualified. If New Residential or New Senior failed to qualify in such years, it could cause us to fail our REIT income tests for such years, which could cause us to lose our REIT status prior to the revocation of our REIT election for 2017, and thereby materially negatively impact our business, financial condition and potentially impair our ability to continue operating in the future.
Uncertainty exists with respect to the treatment of TBAs for purposes of the REIT asset and income tests.
We have invested in and may continue to invest in TBAs and recognize income or gains from the disposition of those TBAs, through dollar roll transactions or otherwise. In a dollar roll transaction, we exchange an existing TBA for another TBA with a different settlement date. There is no direct authority with respect to the qualification of TBAs as real estate assets or U.S. Government securities for purposes of the 75% asset test or the qualification of income or gains from dispositions of TBAs as gains from the sale of real property (including interests in real property and interests in mortgages on real property) or other qualifying income for purposes of the 75% gross income test.
For a particular taxable year, we treated such TBAs as qualifying assets for purposes of the REIT asset tests, and income and gains from such TBAs as qualifying income for purposes of the 75% gross income test, to the extent set forth in an opinion from Skadden, Arps, Slate, Meagher & Flom LLP substantially to the effect that (i) for purposes of the REIT asset tests, our ownership of a TBA should be treated as ownership of the underlying mortgage-backed securities, and (ii) for purposes of the 75% REIT gross income test, any gain recognized by us in connection with the settlement of such TBAs should be treated as gain from the sale or disposition of the underlying mortgage-backed securities. Opinions of counsel are not binding on the IRS, and no assurance can be given that the IRS would not successfully challenge the conclusions set forth in such opinions. In addition, it must be emphasized that any opinion of Skadden, Arps, Slate, Meagher & Flom LLP is based on various assumptions relating to any TBAs that we enter into and would be conditioned upon fact-based representations and covenants made by our management regarding such TBAs. No assurance can be given that the IRS would not assert that such assets or income were not qualifying assets or income. If the IRS were to successfully challenge any conclusions of Skadden, Arps, Slate, Meagher & Flom LLP, we could be subject to a penalty tax or we could fail to qualify as a REIT prior to the revocation of our REIT election for 2017 if a sufficient portion of our assets consisted of TBAs or a sufficient portion of our income consisted of income or gains from the disposition of TBAs.
The failure of assets subject to repurchase agreements to qualify as real estate assets could adversely affect our ability to qualify as a REIT.
We have historically financed a meaningful portion of our investments in securities and loans with repurchase agreements, which are short-term financing arrangements and we may enter into additional repurchase agreements in the future. Under these agreements, we nominally sell certain of our assets to a counterparty and simultaneously enter into an agreement to repurchase these assets at a later date in exchange for a purchase price. Economically, these agreements are financings that are secured by the assets sold pursuant thereto. We believe that, for purposes of the REIT asset and income tests, we should have been treated as the owner of the assets that are the subject of any such sale and repurchase agreement, notwithstanding that those agreements may transfer record ownership of the assets to the counterparty during the term of the agreement. It is possible, however, that the IRS could assert that we did not own the assets during the term of the sale and repurchase agreement, in which case we might fail to qualify as a REIT prior to the revocation of our REIT election in 2017.
We may be subject to adverse legislative or regulatory tax changes that could increase our tax liability, reduce our operating flexibility and reduce the price of our common stock.
The rules dealing with U.S. federal income taxation are continually under review Congress, the IRS, and the U.S. Department of the Treasury. According to publicly released statements, a top legislative priority of the new Congress and administration may be to enact significant reform of the Internal Revenue Code, including significant changes to taxation of business entities and the deductibility of interest expense and capital investment. There is a substantial lack of clarity around the likelihood, timing and details of any such tax reform and the impact of any potential tax reform on us or an investment in our securities, and we cannot, at this time, determine whether any such changes will adversely affect our taxation or the taxation of our stockholders. Any such changes could have an adverse effect on an investment in our shares or on the market value or the resale potential of our assets. You are urged to consult with your tax advisor with respect to the status of legislative, regulatory or administrative developments and proposals and their potential effect on an investment in our shares.
Maintenance of our 1940 Act exclusion imposes limits on our operations.
We conduct our operations in reliance on an exclusion from the 1940 Act, which we refer to as the Section 3(c)(5)(C) exclusion, which is available for entities “primarily engaged in the business of purchasing or otherwise acquiring mortgages and other liens on and interests in real estate.”
Reliance on this exclusion limits our ability to make certain investments. The Section 3(c)(5)(C) exclusion generally requires that at least 55% of our assets be comprised of qualifying real estate assets and at least 80% of our assets be comprised of a combination of qualifying real estate assets and real estate related assets. In satisfying the 55% requirement under the Section 3(c)(5)(C) exclusion, based on guidance from the SEC and its staff, we treat whole pool Agency ARM RMBS issued with respect to an underlying pool of mortgage loans in which we hold all of the certificates issued by the pool as qualifying real estate assets. The SEC and its staff have not issued guidance with respect to whole pool non-Agency RMBS for purposes of the Section 3(c)(5)(C) exclusion. Accordingly, based on our own judgment and analysis of the guidance from the SEC and its staff identifying Agency whole pool certificates as qualifying real estate assets under the Section 3(c)(5)(C) exclusion, we treat whole pool non-Agency ARM RMBS issued with respect to an underlying pool of mortgage loans in which we hold all of the certificates issued by the pool as qualifying real estate assets. We also treat whole mortgage loans that we acquire directly as qualifying real estate assets provided that 100% of the loan is secured by real estate when we acquire the loan and we have the unilateral right to foreclose on the mortgage. In addition, we treat investments in Agency partial pool RMBS and non-Agency partial pool RMBS as real estate related assets for purposes of satisfying the 80% test under the Section 3(c)(5)(C) exclusion. The Section 3(c)(5)(C)
exclusion generally limits the amount of our investments in non-real estate assets to no more than 20% of our total assets. To the extent that we acquire significant non-real estate assets in the future, in order to maintain our exclusion under the 1940 Act, we may need to offset those acquisitions with additional qualifying real estate and real estate related assets, which may not generate risk-adjusted returns as attractive as those generated by non-real estate related assets.
In August 2011, the SEC issued a concept release soliciting public comments on a wide range of issues relating to companies, which are typically REITs, engaged in the business of acquiring mortgages and mortgage-related instruments and that rely on Section 3(c)(5)(C) of the 1940 Act, including the nature of the assets that qualify for purposes of the Section 3(c)(5)(C) exclusion and whether mortgage REITs like us should be regulated in a manner similar to investment companies. Therefore, there can be no assurance that the laws and regulations governing the 1940 Act status of REITs, or guidance from the SEC or its staff regarding the Section 3(c)(5)(C) exclusion, will not change in a manner that adversely affects our operations. If we fail to maintain an exclusion or exception from the 1940 Act, we could, among other things, be required either to (a) change the manner in which we conduct our operations to avoid being required to register as an investment company, (b) effect sales of our assets in a manner that, or at a time when, we would not otherwise choose to do so, or (c) register as an investment company (which, among other things, would require us to comply with the leverage constraints applicable to investment companies), any of which could negatively affect the value of our common stock, the sustainability of our business model, and our ability to make distributions to our stockholders, which could, in turn, materially adversely affect us and the market price of our stock.
Rapid changes in the values of assets that we hold may make it more difficult for us to maintain our exclusion from the 1940 Act.
If the market value or income potential of qualifying assets for purposes of our exclusion from registration as an investment company under the 1940 Act declines as a result of increased interest rates, changes in prepayment rates or other factors, or the market value or income potential from non-qualifying assets increases, we may need to increase our investments in qualifying assets and/or liquidate our non-qualifying assets to maintain our exclusion from registration under the 1940 Act. If the change in market values or income occurs quickly, this may be especially difficult to accomplish. This difficulty may be exacerbated by the illiquid nature of any non-qualifying assets we may own. We may have to make investment decisions that we otherwise would not make absent the intent to maintain our exclusion from registration under the 1940 Act.
Item 1B. Unresolved Staff Comments
We have no unresolved staff comments received more than 180 days prior to December 31, 2016.
Item 2. Properties.
Our direct investments in Traditional Golf properties are described under “Business – Overview.”
Our Manager leases principal executive and administrative offices located at 1345 Avenue of the Americas, New York, New York 10105. Its telephone number is (212) 798-6100.
Our Traditional Golf executive office is located at 909 N. Sepulveda Blvd., Suite 650, El Segundo, CA 90245. Its telephone number is (310) 664-4000.
We maintain our properties in good condition and believe that our current facilities are adequate to meet the present needs of our business. We do not believe any individual property is material to our financial condition or results of operations.
Item 3. Legal Proceedings.
We are and may become involved in legal proceedings, including but not limited to regulatory investigations and inquiries, in the ordinary course of our business. Although we are unable to predict with certainty the eventual outcome of any litigation, regulatory investigation or inquiry, in the opinion of management, we do not expect our current and any threatened legal proceedings, to have a material adverse effect on our business, financial position or results of operations. Given the inherent unpredictability of these types of proceedings, however, it is possible that future adverse outcomes could have a material effect on our financial results.
Item 4. Mine Safety Disclosures
None.
PART II
Item 5. Market for Registrant’s Common Equity, Related Stockholder Matters, and Issuer Purchases of Equity Securities.
The following graph compares the cumulative total return for the Company’s common stock (stock price change plus reinvested dividends) with the comparable return of four indices: NAREIT All REIT, Russell 2000, NAREIT Mortgage REIT and S&P 500. The graph assumes an investment of $100 in the Company’s common stock and in each of the indices on December 31, 2011, and that all dividends were reinvested. The past performance of the Company’s common stock is not an indication of future performance. The Company’s historical stock price has been adjusted to take into consideration the impact of the spin-off of New Residential in May 2013, New Media in February 2014 and New Senior in November 2014. The Company’s share price has also been adjusted to take into consideration the impact of the 1-for-3 reverse stock split in August 2014 and the 1-for-2 reverse stock split in October 2014.
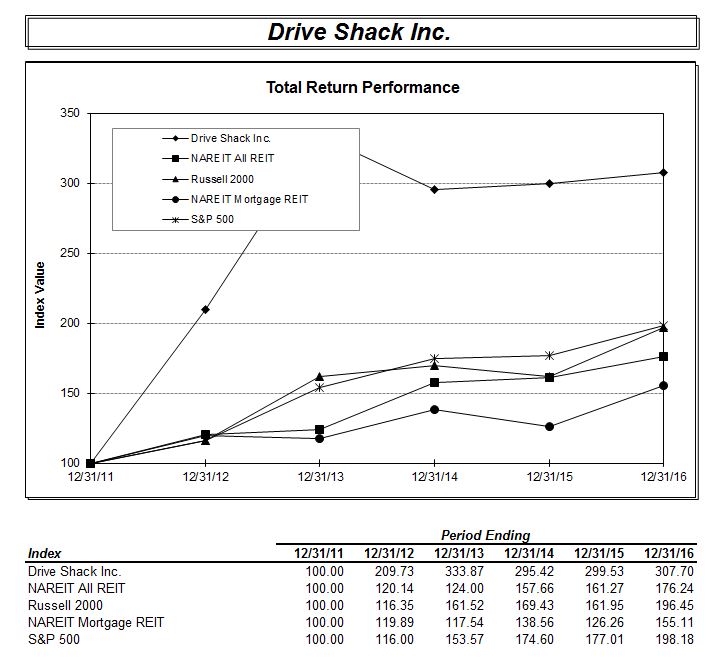
We have one class of common stock, which has been listed and is traded on the NYSE under the symbol “DS” since our initial public offering in October 2002. The following table sets forth, for the periods indicated, the high, low and last sale prices in dollars on the NYSE for our common stock and the distributions we declared with respect to the periods indicated.
|
| | | | | | | | | | | | | | | | |
2016 | | High | | Low | | Last Sale | | Distributions
Declared |
First Quarter | | $ | 4.38 |
| | $ | 2.55 |
| | $ | 4.33 |
| | $ | 0.12 |
|
Second Quarter | | $ | 4.80 |
| | $ | 4.09 |
| | $ | 4.59 |
| | $ | 0.12 |
|
Third Quarter | | $ | 4.88 |
| | $ | 4.44 |
| | $ | 4.53 |
| | $ | 0.12 |
|
Fourth Quarter | | $ | 4.69 |
| | $ | 3.69 |
| | $ | 3.76 |
| | $ | 0.12 |
|
|
| | | | | | | | | | | | | | | | |
2015 | | High | | Low | | Last Sale | | Distributions
Declared |
First Quarter | | $ | 4.95 |
| | $ | 4.04 |
| | $ | 4.85 |
| | $ | 0.12 |
|
Second Quarter | | $ | 5.49 |
| | $ | 4.39 |
| | $ | 4.42 |
| | $ | 0.12 |
|
Third Quarter | | $ | 5.23 |
| | $ | 4.11 |
| | $ | 4.39 |
| | $ | 0.12 |
|
Fourth Quarter | | $ | 5.04 |
| | $ | 3.76 |
| | $ | 4.08 |
| | $ | 0.12 |
|
Prior to termination of our REIT election, we made distributions of a minimum of 90% of our taxable income each year in order to maintain our REIT status. On February 23, 2017, we revoked our election to be treated as a REIT, effective January 1, 2017. Consequently, we are no longer subject to the distribution requirements applicable to REITs. Our board of directors elected not to pay a common stock dividend in the first quarter of 2017 to retain capital for growth. All future dividend distributions will be made at the discretion of our board of directors and will depend upon, among other things, our earnings, investment strategy, financial condition and liquidity, and such other factors as the board of directors deems relevant.
On February 22, 2017, the closing sale price for our common stock, as reported on the NYSE, was $4.26. As of February 22, 2017, there were approximately 32 record holders of our common stock. This figure does not reflect the beneficial ownership of shares held in nominee name.
Option Exercises
On November 22, 2016, five employees of the Manager exercised options in respect of 90,168 shares of the Company’s common stock. The exercise of options by employees of the Manager was accomplished pursuant to a cashless exercise, whereby the employees of the Manager surrendered 176,489 shares of common stock based on the closing market price on November 21, 2016, which was $4.55 per share, to cover the per share exercise price of the options. The options had a weighted average exercise price of $3.01 per share.
The Company offered and sold all the shares of common stock described above in reliance upon Section 4(a)(2) of the Securities Act of 1933 for offerings not involving a public offering. At the time of their investment decisions, each employee of the Manager who received shares was knowledgeable about the Company and its prospects, was a highly sophisticated professional who was able to understand the merits and risks of the investment decision, was an accredited investor, and the transaction involved did not involve any public offering.
Set forth below is information regarding the Company's stock repurchases during the three months ended December 31, 2016:
|
| | | | | | | | | | | | | | |
Period | | Total Number of Shares (or Units) Purchased (#) | | Average Price Paid per Share (or Unit) ($) | | Total Number of Shares (or Units) Purchased as Part of Publicly Announced Plans or Programs (1)(#) | | Approximate Dollar Value of Shares (or Units) that May Yet Be Purchased Under the Plans or Programs ($) |
October 1 - October 31, 2016 | | — |
| | $ | — |
| | — |
| | $ | — |
|
November 1 - November 30, 2016 (A) | | 176,489 |
| | $ | 4.55 |
| | — |
| | $ | — |
|
December 1 - December 31, 2016 | | — |
| | $ | — |
| | — |
| | $ | — |
|
Total | | 176,489 |
| | $ | 4.55 |
| | — |
| | $ | — |
|
| |
A. | See “Option Exercises” above for additional information regarding these transactions. |
Nonqualified Option and Incentive Award Plans
See Note 13 to Part II, Item 8. “Financial Statements and Supplementary Data” for further information related to the terms of the option plans and the Tax Benefit Preservation Plan.
The following table summarizes certain information about securities authorized for issuance under our equity compensation plans as of December 31, 2016.
|
| | | | | | | | | | | |
Plan Category | | Number of Securities to be
Issued Upon Exercise of
Outstanding Options | | Weighted Average Strike Price of Outstanding Options | | Number of Securities Remaining
Available for Future Issuance
Under Equity
Compensation Plans | |
Equity Compensation Plans Approved by Security Holders: | | | | | | | |
Newcastle Investment Corp. Nonqualified Stock Option and Incentive Award Plan | | 978,931 |
| | $ | 2.44 |
| | — |
| |
2012 Newcastle Investment Corp. Nonqualified Stock Option and Incentive Award Plan | | 2,893,078 |
| | 2.45 |
| | 25,820 |
| (B) |
2014 Newcastle Investment Corp. Nonqualified Stock Option and Incentive Award Plan | | 765,416 |
| | 4.01 |
| | — |
| (C) |
2015 Newcastle Investment Corp. Nonqualified Option and Incentive Award Plan | | 333 |
| | 3.78 |
| | — |
| (D) |
2016 Newcastle Investment Corp. Nonqualified Option and Incentive Award Plan | | — |
| | — |
| | 220,462 |
| (E) |
Total Approved | | 4,637,758 |
| (A) | $ | 2.71 |
| | 246,282 |
| |
Equity Compensation Plans Not approved by Security Holders:
None
| |
(A) | Includes options relating to (i) 4,631,124 shares held by an affiliate of our Manager; and (ii) 6,301 shares granted to our Manager and assigned to certain of Fortress’s employees, but does not include options relating to 489,148 shares granted to an affiliate of our Manager with a strike price of $3.57 per share that were not issued pursuant to an equity compensation plan. |
| |
(B) | The maximum available for issuance is 3,333,333 shares in the aggregate over the term of the 2012 Plan and no award shall be granted on or after May 7, 2022 (but awards granted may extend beyond this date). The number of securities remaining available for future issuance is net of (i) an aggregate of 13,312 shares of our common stock awards to our directors, other than Mr. Edens and Mr. Riis, representing the aggregate annual automatic stock awards to each such director for the periods subsequent to the adoption of the 2012 Plan and prior to the adoption of the 2014 Plan and (ii) an aggregate of 3,294,201 options which have been previously granted under the plan. |
| |
(C) | The maximum available for issuance was 166,666 shares in the aggregate over the term of the 2014 Plan and no award (other than a tandem award) may be granted after April 8, 2015 (but awards granted may extend beyond that date). |
| |
(D) | The maximum available for issuance is 300,000 shares in the aggregate over the term of the 2015 Plan and no award (other than a tandem award) may be granted after April 16, 2016 (but awards granted may extend beyond that date). |
| |
(E) | The maximum available for issuance is 300,000 shares in the aggregate over the term of the 2016 Plan and no award (other than a tandem award) may be granted after April 7, 2017 (but awards granted may extend beyond that date). The number of securities remaining available for future issuance is net of (i) an aggregate of 79,538 shares of our common stock awards to our directors, other than Mr. Edens, representing the aggregate annual automatic stock awards to each such director for the periods subsequent to the adoption of the 2016 Plan. There were no options previously granted under the plan. |
Item 6. Selected Financial Data.
The following table presents our selected consolidated financial information as of and for the years ended 2016, 2015, 2014, 2013 and 2012 and other data. The consolidated statements of operations data for the years ended December 31, 2016, 2015 and 2014 and the consolidated balance sheets data as of December 31, 2016 and 2015 have been derived from our audited historical Consolidated Financial Statements included elsewhere herein. The consolidated statements of operations data for the year ended December 31, 2013 and 2012 and the consolidated balance sheets data as of December 31, 2014, 2013 and 2012 have been derived from our consolidated financial statements not included elsewhere herein.
The information below should be read in conjunction with Part II, Item 7. “Management’s Discussion and Analysis of Financial Condition and Results of Operations” and our Consolidated Financial Statements and notes thereto included in Part II, Item 8. “Financial Statements and Supplementary Data.”
Selected Consolidated Financial Information
(in thousands, except per share data) (A)
|
| | | | | | | | | | | | | | | | | | | |
| Year Ended December 31, |
| 2016 | | 2015 | | 2014 | | 2013 | | 2012 |
Operating Data | | | | | | | | | |
Total revenues | $ | 298,880 |
| | $ | 295,856 |
| | $ | 291,537 |
| | $ | — |
| | $ | — |
|
Total operating costs | 338,054 |
| | 318,097 |
| | 276,220 |
| | 1,756 |
| | (202,080 | ) |
Operating income (loss) | (39,174 | ) | | (22,241 | ) | | 15,317 |
| | (1,756 | ) | | 202,080 |
|
Other income (expenses) | 116,699 |
| | 43,494 |
| | 52,474 |
| | 142,550 |
| | 201,565 |
|
Income from continuing operations before income tax | 77,525 |
| | 21,253 |
| | 67,791 |
| | 140,794 |
| | 403,645 |
|
Income tax expense | 189 |
| | 345 |
| | 208 |
| | — |
| | — |
|
Income from continuing operations | 77,336 |
| | 20,908 |
| | 67,583 |
| | 140,794 |
| | 403,645 |
|
Income (loss) from discontinued operations, net of tax | — |
| | 646 |
| | (35,189 | ) | | 11,547 |
| | 30,465 |
|
Net income | 77,336 |
| | 21,554 |
| | 32,394 |
| | 152,341 |
| | 434,110 |
|
Preferred dividends | (5,580 | ) | | (5,580 | ) | | (5,580 | ) | | (5,580 | ) | | (5,580 | ) |
Net (income) loss attributable to noncontrolling interest | (257 | ) | | 293 |
| | 852 |
| | (928 | ) | | — |
|
Income applicable to common stockholders | $ | 71,499 |
| | $ | 16,267 |
| | $ | 27,666 |
| | $ | 145,833 |
| | $ | 428,530 |
|
| | | | | | | | | |
Income Applicable to Common Stock, per share | | | | | | | | | |
Basic | $ | 1.07 |
| | $ | 0.24 |
| | $ | 0.45 |
| | $ | 3.16 |
| | $ | 17.84 |
|
Diluted | $ | 1.04 |
| | $ | 0.24 |
| | $ | 0.44 |
| | $ | 3.09 |
| | $ | 17.64 |
|
Income from Continuing Operations per share of Common Stock, after preferred dividends and noncontrolling interest | | | | | | | | | |
Basic | $ | 1.07 |
| | $ | 0.23 |
| | $ | 1.02 |
| | $ | 2.91 |
| | $ | 16.57 |
|
Diluted | $ | 1.04 |
| | $ | 0.23 |
| | $ | 1.00 |
| | $ | 2.84 |
| | $ | 16.39 |
|
Income (loss) from Discontinued Operations per share of Common Stock | | | | | | | | | |
Basic | $ | — |
| | $ | 0.01 |
| | $ | (0.57 | ) | | $ | 0.25 |
| | $ | 1.27 |
|
Diluted | $ | — |
| | $ | 0.01 |
| | $ | (0.57 | ) | | $ | 0.24 |
| | $ | 1.25 |
|
Weighted Average Number of Shares of Common Stock Outstanding | | | | | | | | | |
Basic | 66,709,925 |
| | 66,479,321 |
| | 61,500,913 |
| | 46,146,882 |
| | 24,024,395 |
|
Diluted | 68,788,440 |
| | 68,647,915 |
| | 63,131,227 |
| | 47,218,274 |
| | 24,294,402 |
|
Dividends declared per share of common stock | $ | 0.48 |
| | $ | 0.48 |
| | $ | 1.92 |
| | $ | 3.54 |
| | $ | 5.04 |
|
|
| | | | | | | | | | | | | | | | | | | |
| As of December 31, |
| 2016 | | 2015 | | 2014 | | 2013 | | 2012 |
Balance Sheet Data | | | | | | | | | |
Real estate securities, available-for-sale | $ | 1,950 |
| | $ | 59,034 |
| | $ | 231,754 |
| | $ | 432,993 |
| | $ | 871,040 |
|
Real estate securities, pledged as collateral | 627,304 |
| | 105,963 |
| | 407,689 |
| | 551,270 |
| | 820,535 |
|
Real estate related loans, held-for-sale, net | 55,612 |
| | 149,198 |
| | 230,200 |
| | 437,530 |
| | 843,132 |
|
Residential mortgage loans, held-for-investment, net | — |
| | — |
| | — |
| | 255,450 |
| | 292,461 |
|
Investments in real estate, net | 217,611 |
| | 227,907 |
| | 239,283 |
| | 250,208 |
| | — |
|
Intangibles, net | 65,112 |
| | 74,472 |
| | 84,686 |
| | 95,548 |
| | — |
|
Other investments | 19,256 |
| | 20,595 |
| | 26,788 |
| | 25,468 |
| | 24,907 |
|
Cash and cash equivalents | 140,140 |
| | 45,651 |
| | 73,727 |
| | 42,421 |
| | 221,798 |
|
Restricted cash | 6,404 |
| | 4,469 |
| | 15,714 |
| | 5,856 |
| | 2,031 |
|
Assets of discontinued operations | — |
| | — |
| | 6,803 |
| | 2,248,023 |
| | 448,920 |
|
Total assets | 1,171,958 |
| | 1,467,982 |
| | 1,761,906 |
| | 4,837,124 |
| | 3,945,312 |
|
Total debt | 767,465 |
| | 970,842 |
| | 1,314,840 |
| | 1,940,592 |
| | 2,661,236 |
|
Liabilities of discontinued operations | — |
| | — |
| | 447 |
| | 1,434,394 |
| | 126,895 |
|
Total liabilities | 953,891 |
| | 1,257,860 |
| | 1,503,578 |
| | 3,611,511 |
| | 2,872,252 |
|
Common stockholders’ equity (deficit) | 156,484 |
| | 148,796 |
| | 196,709 |
| | 1,103,262 |
| | 1,011,477 |
|
Preferred stock | 61,583 |
| | 61,583 |
| | 61,583 |
| | 61,583 |
| | 61,583 |
|
Noncontrolling interest | — |
| | (257 | ) | | 36 |
| | 61,279 |
| | — |
|
| | | | | | | | | |
Supplemental Balance Sheet Data | | | | | | | | | |
Common shares outstanding | 66,824,304 |
| | 66,654,598 |
| | 66,424,508 |
| | 58,575,582 |
| | 28,754,274 |
|
Book value per share of common stock | $ | 2.34 |
| | $ | 2.23 |
| | $ | 2.96 |
| | $ | 18.83 |
| | $ | 35.18 |
|
| | | | | | | | | |
Other Data | | | | | | | | | |
Core Earnings (B) | $ | 47,316 |
| | $ | 38,125 |
| | $ | 99,993 |
| | $ | 140,903 |
| | $ | 163,217 |
|
| |
(A) | Selected consolidated financial information includes the impact of the spin-offs of New Residential, New Media and New Senior and the sale of the commercial real estate properties in Beavercreek, OH. For all periods presented, the assets, liabilities and results of operations are presented separately in discontinued operations. |
| |
(B) | The following primary variables impact our operating performance: (i) the current yield earned on our investments that are not included in non-recourse financing structures (i.e., unlevered investments, including investments in equity method investees and investments subject to recourse debt), (ii) the net yield we earn from our non-recourse financing structures, (iii) the interest expense and dividends incurred under our recourse debt and preferred stock, (iv) the net operating income on our real estate and golf investments, (v) our operating expenses and (vi) our realized and unrealized gains or losses, net of related provision for income taxes, including any impairment, on our investments, derivatives and debt obligations. Core earnings is a non-GAAP measure of our operating performance excluding the sixth variable listed above. Core earnings also excludes depreciation and amortization charges, including the accretion of membership deposit liabilities and the impact of the application of acquisition accounting, acquisition and spin-off related expenses and restructuring expenses. Core earnings is used by management to evaluate our performance without taking into account gains and losses, net of related provision for income taxes, which, although they represent a part of our recurring operations, are subject to significant variability and are only a potential indicator of future performance. These adjustments to our income applicable to common stockholders are not indicative of the performance of the assets that form the core of our activity. |
Management utilizes core earnings as a measure in its decision-making process relating to the underlying fundamental operations of our investments, as well as the allocation of resources between those investments, and management also relies on core earnings as an indicator of the results of such decisions. As such, core earnings is not intended to reflect all of our activity and should be considered as only one of the factors in assessing our performance, along with GAAP net income, which is inclusive of all of our activities. Management also believes that the exclusion from core earnings of the items specified above allows investors and analysts to readily identify and track the operating performance of the assets that form the core of our activity, assists in comparing the core operating results between periods, and enables investors to evaluate our current core performance using the same measure that management uses to operate the business.
Core earnings does not represent an alternative to net income as an indicator of our operating performance or as an alternative to cash flows from operating activities as a measure of our liquidity, and is not indicative of cash available to fund cash needs. For a further description of the differences between cash flows provided by operations and net income, see “– Liquidity and Capital Resources” below. Our calculation of core earnings may be different from the calculation used by other companies and, therefore, comparability may be limited.
Calculation of Core Earnings:
|
| | | | | | | | | | | |
| Year Ended December 31, |
| 2016 | | 2015 | | 2014 |
Income applicable to common stockholders | $ | 71,499 |
| | $ | 16,267 |
| | $ | 27,666 |
|
Add (deduct): | | | | | |
Impairment (reversal) | 10,381 |
| | 11,896 |
| | (2,419 | ) |
Realized/unrealized (gain) loss on investments | 685 |
| | (22,264 | ) | | (69,593 | ) |
Other (income) (A) | (76,760 | ) | | (8,274 | ) | | (995 | ) |
Impairment (reversal), other (income) loss and other adjustments from discontinued operations (B) | — |
| | (307 | ) | | 104,226 |
|
Depreciation and amortization (C) | 36,749 |
| | 39,416 |
| | 37,629 |
|
Acquisition, transaction, restructuring and spin-off related expenses (D) | 4,762 |
| | 1,391 |
| | 3,479 |
|
Core earnings | $ | 47,316 |
| | $ | 38,125 |
| | $ | 99,993 |
|
| |
(A) | Other income reconciliation: |
|
| | | | | | | | | | | |
| Year Ended December 31, |
| 2016 | | 2015 | | 2014 |
Total other income | $ | 116,699 |
| | $ | 43,494 |
| | $ | 52,474 |
|
Add (deduct): | | | | | |
Equity in earnings from equity method investees (E) | (1,516 | ) | | (1,311 | ) | | (954 | ) |
Interest and investment income | (91,291 | ) | | (95,891 | ) | | (127,627 | ) |
Interest expense | 52,868 |
| | 62,129 |
| | 80,022 |
|
Provision for income tax relating to gain on extinguishment of debt | — |
| | (147 | ) | | — |
|
Deal expenses related to the sale of the residential loan and manufactured housing portfolios | — |
| | — |
| | (2,920 | ) |
Other income | $ | 76,760 |
| | $ | 8,274 |
| | $ | 995 |
|
The deal expenses were recorded to general and administrative expense under GAAP during 2014.
| |
(B) | Includes gain on settlement of investments of $0.3 million during the year ended December 31, 2015. Includes depreciation and amortization of less than $0.1 million and $90.6 million (gross of $0 and $0.7 million) during the years ended December 31, 2015 and 2014, respectively. Includes acquisition and spin-off related expenses of $15.8 million and other (income) of ($1.4) million during the year ended December 31, 2014. |
| |
(C) | Including accretion of membership deposit liabilities of $5.8 million, $5.8 million and $5.7 million, and amortization of favorable and unfavorable leasehold intangibles of $4.5 million, $4.9 million and $5.0 million during the years ended December 31, 2016, 2015 and 2014, respectively. The accretion of membership deposit liabilities was recorded to interest expense and the amortization of favorable and unfavorable leasehold intangibles was recorded to operating expenses. |
| |
(D) | Including acquisition and transaction expenses of $4.4 million, $1.1 million and $2.6 million and restructuring expenses of $0.4 million, $0.3 million and $0.9 million during the years ended December 31, 2016, 2015 and 2014, respectively. The acquisition and transaction expenses were recorded to general and administrative expense and restructuring expenses were recorded to operating expenses. |
| |
(E) | Equity in earnings from equity method investees excludes impairment of $2.9 million and $7.5 million during the years ended December 31, 2016 and 2015, respectively. There was no impairment reported during the year ended December 31, 2014. |
Item 7. Management’s Discussion and Analysis of Financial Condition and Results of Operations.
The following should be read in conjunction with our Consolidated Financial Statements and notes thereto included in Part II, Item 8. “Financial Statements and Supplementary Data,” and Part I, Item 1A. “Risk Factors.”
General
Drive Shack Inc. is a leading owner and operator of golf-related leisure and entertainment businesses. Drive Shack Inc.'s common stock is traded on the NYSE under the symbol “DS.” Drive Shack Inc. is externally managed and advised by an affiliate of Fortress Investment Group LLC, or Fortress (the “Manager”).
For further information relating to Drive Shack Inc.’s business, see “Item 1. Business.”
We report our business through the following segments: (i) Traditional Golf, (ii) Entertainment Golf, (iii) Debt Investments, and (iv) corporate.
Revenues attributable to each segment, as restated for previously reported periods, are disclosed below (in thousands).
|
| | | | | | | | | | | | | | | | | | | | | | | |
| | | | | | | | | | Inter-segment
Elimination | | | |
For the Year Ended | | TraditionalGolf | | Entertainment Golf | | Debt Investments | | Corporate | | | Total | |
December 31, 2016 | | $ | 299,014 |
| | N/A | | $ | 91,107 |
| | $ | 50 |
| | $ | — |
| | $ | 390,171 |
| |
December 31, 2015 | | $ | 296,008 |
| | N/A | | $ | 98,721 |
| | $ | 23 |
| | $ | (3,005 | ) | | $ | 391,747 |
| (A) |
December 31, 2014 | | $ | 291,684 |
| | N/A | | $ | 135,031 |
| | $ | 44 |
| | $ | (7,595 | ) | | $ | 419,164 |
| (B) |
| |
(A) | Excludes $0.6 million of revenue included in discontinued operations related to the sale of commercial real estate. |
| |
(B) | Excludes $283.4 million of revenues included in discontinued operations related to senior housing, media and the sale of commercial real estate. |
Market Considerations
Our ability to execute our business strategy, particularly the development of our Entertainment Golf business, depends to a degree on our ability to monetize our Debt Investments and obtain additional capital. We have not accessed the capital markets since 2014, and rising interest rates or stock market volatility could impair our ability to raise equity capital on attractive terms.
Our ability to generate income is dependent on, among other factors, our ability to raise capital and finance investments on favorable terms, deploy capital on a timely basis at attractive returns, and exit investments at favorable yields. Market conditions outside of our control, such as interest rates, credit spreads and stock market volatility affect these objectives in a variety of ways.
Traditional Golf
With respect to our Traditional Golf business, trends in consumer discretionary spending as well as climate and weather patterns have a significant impact on the markets in which we operate. Traditional Golf is subject to seasonal fluctuations caused by significant reductions in golf activities as well as revenue in the first and fourth quarters of each year, due to shorter days and colder temperatures. Consequently, a significantly larger portion of our revenue from our Traditional Golf operations is earned in the second and third quarters of our fiscal year. In addition, severe weather patterns can also negatively impact our results of operations.
While consumer spending in the Traditional Golf industry has generally been declining in recent years, we believe improving economic conditions and improvements in local housing markets has helped and will continue to help drive membership growth and increase the number of golf rounds played. In addition, we believe growth in related industries, including leisure entertainment, can positively impact our traditional golf business.
Debt Investments
During the year, both short-term and long-term interest rates remained at or near historical lows. We project short– and long–term rates to increase in the future, although the timing of any further increases is uncertain. We have investments in both floating and fixed rate securities and loans, which are affected by interest rates in different ways. We expect that the value of our floating rate assets would not be significantly affected by a change in interest rates (whether an increase or decrease), since the coupon tracks the movement in rates, while the value of fixed rate assets can be negatively affected by rising interest rates. However, in general, rising interest rates are usually indicative of a strengthening economic environment, which could reduce the credit risk of some of our investments. With respect to our fixed rate assets, we believe that the negative impact of rising interest rates could potentially be offset by the positive impact of reduced credit risk.
Credit spreads also affect the value of our investments in debt securities and loans. Credit spreads decreased or "tightened," marginally during 2015 and 2016, which had a minimal impact on the value of our portfolio. Credit spreads measure the yield relative to a specified benchmark that the market demands on securities and loans based on the credit risk of such assets. The value of our portfolio tends to increase when spreads tighten and to decrease when spreads widen. Credit spreads also affect the cost of financing, with widening spreads tending to increase the cost, and tightening spreads tending to reduce it.
The net interest spread of our portfolio of Debt Investments can be impacted by (i) the timing and extent of changes in the composition of our portfolio as a result of purchases and sales of assets or the repayment of debt, repurchase agreements and other
bonds, the incurrence of new debt, (ii) the yields on new investments, which varies depending on the credit quality of the issuer, and (iii) changes in our estimates of the yields on securities acquired at a discount for credit quality. For instance, the net interest spread of our Debt Investments increases if we sell assets with lower yields relative to other assets in our portfolio or repay debt (such as in connection with an asset sale or refinancing) that has a higher interest rate relative to other financing on our portfolio (assuming no other changes to the composition of our portfolio). Conversely, the net interest spread of our portfolio decreases if we sell assets with higher yields relative to other assets in our portfolio or repay debt (such as in connection with an asset sale) that has a lower interest rate relative to other financing on our portfolio (again, assuming no other changes to the composition of our portfolio). Management continually monitors market conditions to opportunistically effect purchases and sales of debt investments.
Application of Critical Accounting Policies
Management’s discussion and analysis of financial condition and results of operations is based upon our Consolidated Financial Statements, which have been prepared in accordance with U.S. generally accepted accounting principles (“GAAP”). The preparation of financial statements in conformity with GAAP requires the use of estimates and assumptions that could affect the reported amounts of assets and liabilities, the disclosure of contingent assets and liabilities and the reported amounts of revenue and expenses. Our estimates are based on information available to management at the time of preparation of the Consolidated Financial Statements, including the result of historical analysis, our understanding and experience of the Company’s operations, our knowledge of the industry and market-participant data available to us.
Actual results have historically been in line with management’s estimates and judgments used in applying each of the accounting policies described below and management periodically re-evaluates accounting estimates and assumptions. Actual results could differ from these estimates and materially impact our Consolidated Financial Statements. However, the Company does not expect our assessments and assumptions below to materially change in the future.
A summary of our significant accounting policies is presented in Note 2 to our Consolidated Financial Statements, which appear in Part II, Item 8. “Financial Statements and Supplementary Data.” The following is a summary of our accounting policies that are most affected by judgments, estimates and assumptions.
Variable Interest Entities
Variable interest entities (“VIEs”) are defined as entities in which equity investors do not have the characteristics of a controlling financial interest or do not have sufficient equity at risk for the entity to finance its activities without additional subordinated financial support from other parties. A VIE is required to be consolidated by its primary beneficiary, and only by its primary beneficiary, which is defined as the party who has the power to direct the activities of a VIE that most significantly impact its economic performance and who has the obligation to absorb losses or the right to receive benefits from the VIE that could potentially be significant to the VIE.
The VIEs in which we have a significant interest include our CDOs. We do not have the power to direct the relevant activities of CDO V, as a result of an event of default which allows for us to be removed as collateral manager of this CDO and prevents us from purchasing or selling certain collateral within this CDO, and therefore this CDO is not consolidated as of December 31, 2016. In August 2016, the Company settled on a trade to sell $14.8 million face amount of two CDO V securities for total proceeds of $9.9 million (See Note 5 to Part II, Item 8. “Financial Statements and Supplementary Data” for additional information). As a result of this trade, the Company no longer has an economic interest in CDO V.
On March 31, 2016, Drive Shack Inc. sold $11.0 million face amount of NCT 2013-VI Class I-MM-2. As a result of this sale, the Company was no longer deemed to be the primary beneficiary and deconsolidated CDO VI.
Our subprime securitizations are also considered VIEs, but we do not control the decisions that most significantly impact their economic performance and no longer receive a significant portion of their returns, and therefore do not consolidate them.
In addition, our investments in RMBS and real estate related and other loans may be deemed to be variable interests in VIEs, depending on their structure. We monitor these investments and analyze the potential need to consolidate the related securitization entities pursuant to the VIE consolidation requirements. These analyses require considerable judgment in determining whether an entity is a VIE and determining the primary beneficiary of a VIE since they involve subjective determinations of significance, with respect to both power and economics. The result could be the consolidation of an entity that otherwise would not have been consolidated or the deconsolidation of an entity that otherwise would have been consolidated.
Valuation of Securities
We have classified all of our real estate securities as available-for-sale. As such, they are carried at fair value with net unrealized gains or losses reported as a component of accumulated other comprehensive income, to the extent impairment losses are considered temporary as described below. Fair value may be based upon broker quotations, counterparty quotations or pricing services quotations, which provide valuation estimates based upon reasonable market order indications or a good faith estimate thereof and are subject to significant variability based on market conditions, such as interest rates, credit spreads and market liquidity. A significant portion of our securities are currently not traded in active markets and therefore have little or no price transparency. As a result, we have estimated the fair value of these illiquid securities based on internal pricing models rather than the sources described above. The determination of estimated cash flows used in pricing models is inherently subjective and imprecise. Changes in market conditions, as well as changes in the assumptions or methodology used to determine fair value, could result in a significant and immediate increase or decrease in our book equity. For securities valued with pricing models, these inputs include the discount rate, assumptions relating to prepayments, default rates and loss severities, as well as other variables.
See Note 10 to our Consolidated Financial Statements in Part II, Item 8. “Financial Statements and Supplementary Data” for information regarding the fair value of our investments, and respective estimation methodologies, as of December 31, 2016.
Our securities must be categorized by the “level” of inputs used in estimating their fair values. Level 1 would be assets or liabilities valued based on quoted prices for identical instruments in active markets. We have no Level 1 assets or liabilities. Level 2 would be assets or liabilities valued based on quoted prices in active markets for similar instruments, on quoted prices in less active or inactive markets, or on other “observable” market inputs. Level 3 would be assets or liabilities valued based significantly on “unobservable” market inputs. Fair value under GAAP represents an exit price in the normal course of business, not a forced liquidation price. If we were forced to sell assets in a short period to meet liquidity needs, the prices we receive could be substantially less than the recorded fair values.
We generally classify non-binding broker and pricing service quotations we receive as Level 3 inputs. Such quotations are quoted prices in generally inactive and illiquid markets for identical or similar securities. These quotations are generally received via email and contain disclaimers which state that they are “indicative” and “not actionable” - meaning that the party giving the quotation is not bound to actually purchase the security at the quoted price. These quotations are generally based on models prepared by the brokers, and we have little visibility into the inputs they use. Based on quarterly procedures we have performed with respect to quotations received from these brokers, including comparison to the outputs generated from our internal pricing models and transactions we have completed with respect to these securities, as well as on our knowledge and experience of these markets, we have generally determined that these quotes represent a reasonable estimate of fair value.
As of December 31, 2016, we had $627.3 million carrying value of Level 2 assets.
Our estimation of the fair value of Level 3 assets valued using internal models involves significant judgment. The inputs to our models include discount rates, prepayment speeds, default rates and severity assumptions. We validate the inputs and outputs of our models by comparing them to available independent third-party market parameters and models for reasonableness, as well as historical performance. We believe the assumptions we use are within the range that a market participant would use and factor in the liquidity conditions currently in the markets. In 2016, the inputs to our models, including discount rates, prepayment speeds, default rates and severity assumptions, have generally remained consistent with the assumptions used at December 31, 2015.
For securities valued with internal models, which have an aggregate fair value of $2.0 million as of December 31, 2016, a 10% unfavorable change in our assumptions would result in the following decreases in such aggregate fair value (in thousands):
|
| | | |
| ABS - Non-Agency RMBS |
Outstanding face amount | $ | 4,000 |
|
Fair value | $ | 1,950 |
|
Effect on fair value with 10% unfavorable change in: | |
Discount rate | $ | (161 | ) |
A 10% unfavorable change in prepayment rate, default rate and loss severity have no impact on the ABS - Non-Agency RMBS fair value.
Impairment of Securities and Other Investments
We must also assess whether unrealized losses on securities, if any, reflect a decline in value which is other-than-temporary and, if so, write the impaired security down to its fair value through earnings. A decline in value is deemed to be other-than-temporary if (i) it is probable that we will be unable to collect all amounts due according to the contractual terms of a security which was not impaired at acquisition (there is an expected credit loss), or (ii) if we have the intent to sell a security in an unrealized loss position or it is more likely than not we will be required to sell a security in an unrealized loss position prior to its anticipated recovery (if any). For the purposes of performing this analysis, we assume the anticipated recovery period is until the respective security’s expected maturity. For certain securities which represent beneficial interests in securitized financial assets and non-Agency RMBS acquired with evidence of deteriorated credit quality for which it was deemed probable, at acquisition, that we would be unable to collect all contractually required payments as they come due, an other-than-temporary impairment also will be deemed to have occurred whenever there is a probable adverse change in the timing or amounts of previously projected estimated cash flows.
Temporary declines in value generally result from changes in market factors, such as market interest rates and credit spreads, or from certain macroeconomic events, including market disruptions and supply changes, which do not directly impact our ability to collect amounts contractually due. We continually evaluate the credit status of each of our securities and the collateral supporting our securities. This evaluation includes a review of the credit of the issuer of the security (if applicable), the credit rating of the security, the key terms of the security (including credit support), debt service coverage and loan to value ratios, the performance of the pool of underlying loans and the estimated value of the collateral supporting such loans, including the effect of local, industry and broader economic trends and factors. These factors include loan default expectations and loss severities, which are analyzed in connection with a particular security’s credit support, as well as prepayment rates. These factors are also analyzed in relation to the amount of the unrealized loss and the period elapsed since it was incurred. The result of this evaluation is considered when determining management’s estimate of cash flows, particularly with respect to developing the necessary inputs and assumptions. Each security is impacted by different factors and in different ways; generally the more negative factors which are identified with respect to a given security, the more likely we are to determine that we do not expect to receive all contractual payments when due with respect to that security. Significant judgment is required in this analysis.
We generally do not depend on credit ratings in underwriting our securities, either at acquisition or on an ongoing basis. As of December 31, 2016, we had no securities that had been downgraded during 2016. As mentioned above, a credit rating downgrade is one factor that we monitor and consider in our analysis regarding other-than-temporary impairment, but it is not determinative. Our securities generally benefit from the support of one or more subordinate classes of securities or equity or other forms of credit support. Therefore, credit rating downgrades, even to the extent they relate to an expectation that a securitization we have invested in, on an overall basis, has credit issues, may not ultimately impact cash flow estimates for the class of securities in which we are invested.
Furthermore, the analysis of whether it is more likely than not that we will be required to sell securities in an unrealized loss position prior to an expected recovery in value (if any), the amount of such expected required sales, and the projected identification of which securities would be sold is also subject to significant judgment.
We evaluate our other investments for impairment whenever events or changes in circumstances indicate that the carrying amount might not be recoverable. The evaluation of recoverability is based on management’s assessment of the financial condition and near term prospects of the commercial real estate project, the length of time and the extent to which the market value of the investment has been less than cost, availability and cost of financing, demand for space, competition for tenants, changes in market rental rates, and operating costs. As these factors are difficult to predict and are subject to future events that may alter management’s assumptions, the values estimated by management in its recoverability analyses may not be realized, and actual losses or impairment may be realized in the future.
Revenue Recognition on Securities
Income on these securities is recognized using a level yield methodology based upon a number of cash flow assumptions that are subject to uncertainties and contingencies. For securities that are not acquired at a discount for credit quality, these assumptions include the rate and timing of principal and interest receipts (which may be subject to prepayments and defaults). For securities acquired at a discount for credit quality and with respect to which management has determined at acquisition that it is probable that we will not collect all contractually required principal and interest payments, these assumptions also include expected losses. For these securities, we recognize the excess of all expected cash flows over our investment in the securities, referred to as accretable yield, as Interest Income on a loss-adjusted yield basis. The loss adjusted yield is determined based on an evaluation of the credit status of securities, as described in connection with the analysis of impairment above. The excess of total contractual cash flows over the cash flows expected to be collected is referred to as the nonaccretable difference and is not recognized as income. The assumptions that impact income recognition are updated on at least a quarterly basis to reflect changes related to a particular
security, actual historical data, and market changes. These uncertainties and contingencies are difficult to predict and are subject to future events, and economic and market conditions, which may alter the assumptions.
Valuation of Derivatives
Our derivative instruments are carried at fair value which is based on counterparty quotations and pricing services. The Company reports the fair value of derivative instruments gross of cash paid or received pursuant to credit support agreements. To the extent they qualify as cash flow hedges, net unrealized gains or losses are reported as a component of accumulated other comprehensive income; otherwise, the net unrealized gains and losses are reported currently in other income. To the extent they qualify as fair value hedges, net unrealized gains or losses on both the derivative and the related portion of the hedged item are reported currently in income. Fair values of such derivatives are subject to significant variability based on many of the same factors as the securities discussed above, including counterparty credit risk. The results of such variability, the effectiveness of our hedging strategies and the extent to which a forecasted hedged transaction remains probable of occurring, could result in a significant increase or decrease in our GAAP equity and/or earnings.
Loans
We invest in loans, including, but not limited to, real estate related and other loans, residential mortgage loans and subprime mortgage loans. Loans for which we have the intent and ability to hold for the foreseeable future, or until maturity or payoff, are classified as held-for-investment. Loans for which we do not have the intent or the ability to hold for the foreseeable future, or until maturity or payoff, are classified as held-for-sale. Loans are presented in the Consolidated Balance Sheet net of any unamortized discount (or gross of any unamortized premium) and an allowance for loan losses. We determine at acquisition whether loans will be aggregated into pools based on common risk characteristics (credit quality, loan type, and date of origination or acquisition); loans aggregated into pools are accounted for as if each pool were a single loan. We also evaluate our loans at acquisition for evidence of credit quality deterioration. Loans for which we determine that it is probable that we will not collect all contractually required principal and interest payments at acquisition are categorized as loans acquired at a discount for credit quality.
Revenue Recognition on Loans Held for Sale
Real estate related, commercial mortgage and residential mortgage loans that are considered held for sale are carried at the lower of amortized cost or market value determined on either an individual method basis, or in the aggregate for pools of similar loans. Interest income is recognized based on the loan’s coupon rate to the extent management believes it is collectible. Purchase discounts are not amortized as interest income during the period the loan is held for sale, except when a pay down or sale has happened in the period. Similarly, for loans acquired at a discount for credit quality, accretable yield is not recorded as interest income during the period the loan is held for sale. A change in the market value of the loan, to the extent that the value is not above the average cost basis, is recorded in Valuation Allowance. A rollforward of the allowance is included in Note 6 to our Consolidated Financial Statements in Part II, Item 8. “Financial Statements and Supplementary Data.”
Acquisition Accounting
In connection with an acquisition of a business, assets acquired and liabilities assumed are recorded at fair value as of the acquisition date. The accounting for acquisitions requires the identification and measurement of all acquired tangible and intangible assets and assumed liabilities at their respective fair values as of the acquisition date. In measuring the fair value of net tangible and identified intangible assets acquired, management uses information obtained as a result of pre-acquisition due diligence, marketing, leasing activities and independent appraisals. The determination of fair value involves the use of significant judgment and estimation.
Impairment of Investments in Real Estate
Real estate and long-lived assets are tested for potential impairment when changes in circumstances indicate the carrying value may not be recoverable. Indicators of impairment include material adverse changes in the projected revenues and expenses, significant underperformance relative to historical or projected future operating results, and significant negative industry or economic trends. An impairment is determined to have occurred if the future net undiscounted cash flows expected to be generated is less than the carrying value of an asset. The impairment is measured as the difference between the carrying value and the fair value. Significant judgment is required both in determining impairment and in estimating the fair value. We may use assumptions and estimates derived from a review of our operating results, business projections, expected growth rates, discount rates, and tax rates. We also make certain assumptions about future economic conditions, interest rates, and other market data. Many of the factors used in these assumptions and estimates are outside the control of management, and can change in future periods.
Intangible Assets
We assess the potential impairment of intangible assets with indefinite lives on an annual basis or if an event occurs or circumstances change between annual tests that indicate that it is more likely than not that the asset is impaired. We perform our impairment test by comparing the fair value of the intangible asset with its carrying amount. If the carrying amount exceeds its fair value, an impairment loss will be recognized in an amount equal to that excess.
We assess the recoverability of our definite lived intangible assets, whenever events or changes in business circumstances indicate the carrying amount of the assets, or other appropriate grouping of assets, may not be fully recoverable. The assessment of recoverability is based on comparing management’s estimates of the sum of the estimated undiscounted cash flows generated by the underlying asset, or other appropriate grouping of assets, to its carrying value to determine whether an impairment existed at its lowest level of identifiable cash flows. Factors leading to impairment include significant under-performance relative to historical or projected results, significant changes in the manner of use of the acquired assets or the strategy for our overall business and significant negative industry or economic trends.
Membership Deposit Liabilities
In our Traditional Golf business, private country club members generally pay an advance initiation fee deposit upon their acceptance as a member to the respective country club. Initiation fee deposits are refundable 30 years after the date of acceptance as a member. The difference between the initiation fee deposit paid by the member and the present value of the refund obligation is deferred and recognized into revenue in the Consolidated Statements of Operations on a straight-line basis over the expected life of an active membership, which is estimated to be seven years. The present value of the refund obligation is recorded as a membership deposit liability in the Consolidated Balance Sheets and accretes over a 30-year nonrefundable term using the effective interest method. This accretion is recorded as interest expense in the Consolidated Statements of Operations. The determination of the estimated average expected life of an active membership is based on company-specific historical data and involves significant judgment and estimation.
Recent Accounting Pronouncements
See Note 2 to Part II, Item 8. “Financial Statements and Supplementary Data” for information about recent accounting pronouncements.
Results of Operations
Consolidated Results
The following tables summarize the changes in our consolidated results of operations from year-to-year (dollars in thousands):
|
| | | | | | | | | | | | | | |
Comparison of Results of Operations for the years ended December 31, 2016 and 2015 |
| | | | | | | |
| Year Ended December 31, | | Increase (Decrease) |
| 2016 | | 2015 | | Amount | | % |
Revenues | | | | | | |
|
|
Golf course operations | $ | 226,255 |
| | $ | 224,419 |
| | $ | 1,836 |
| | 0.8 | % |
Sales of food and beverages | 72,625 |
| | 71,437 |
| | 1,188 |
| | 1.7 | % |
Total revenues | 298,880 |
| | 295,856 |
| | 3,024 |
| | 1.0 | % |
| | | | | | |
|
|
Operating costs | | | | |
|
| |
|
|
Operating expenses | 254,353 |
| | 254,553 |
| | (200 | ) | | (0.1 | )% |
Cost of sales - food and beverages | 21,593 |
| | 22,549 |
| | (956 | ) | | (4.2 | )% |
General and administrative expense | 13,842 |
| | 12,037 |
| | 1,805 |
| | 15.0 | % |
Management fee to affiliate | 10,704 |
| | 10,692 |
| | 12 |
| | 0.1 | % |
Depreciation and amortization | 26,496 |
| | 28,634 |
| | (2,138 | ) | | (7.5 | )% |
Impairment (reversal) | 10,381 |
| | 11,896 |
| | (1,515 | ) | | (12.7 | )% |
Realized/unrealized (gain) loss on investments | 685 |
| | (22,264 | ) | | 22,949 |
| | 103.1 | % |
Total operating costs | 338,054 |
| | 318,097 |
| | 19,957 |
| | 6.3 | % |
Operating loss | (39,174 | ) | | (22,241 | ) | | (16,933 | ) | | (76.1 | )% |
| | | | |
|
| |
|
|
Other income (expenses) | | | | | | |
|
|
Interest and investment income | 91,291 |
| | 95,891 |
| | (4,600 | ) | | (4.8 | )% |
Interest expense | (52,868 | ) | | (62,129 | ) | | (9,261 | ) | | (14.9 | )% |
Gain (loss) on extinguishment of debt | (780 | ) | | 15,306 |
| | (16,086 | ) | | (105.1 | )% |
Gain on deconsolidation | 82,130 |
| | — |
| | 82,130 |
| | N.M. |
|
Other income (loss), net | (3,074 | ) | | (5,574 | ) | | 2,500 |
| | 44.9 | % |
Total other income | 116,699 |
| | 43,494 |
| | 73,205 |
| | 168.3 | % |
| | | | | | | |
Income from continuing operations before income tax | $ | 77,525 |
| | $ | 21,253 |
| | $ | 56,272 |
| | 264.8 | % |
N.M. – Not meaningful
Golf Course Operations
Golf course operations increased by $1.8 million during the year ended December 31, 2016 compared to the year ended December 31, 2015 primarily due to: (i) a $5.5 million increase in net driving range revenues at public golf properties as a result of the continued growth of The Players Club program, (ii) a $2.0 million increase due to additional initiation fees from new member sales and higher membership dues rates, partially offset by (iii) a $3.4 million decrease in green fee and cart rental revenue as a result of unfavorable conditions, especially in California, (iv) a $1.9 million decrease in greens and cart fees and merchandise sales from lease terminations in 2016 and (v) a $0.4 million decrease in sales of merchandise due to unfavorable conditions, especially in California.
Sales of Food and Beverages
Sales of food and beverages increased by $1.2 million during the year ended December 31, 2016 compared to the year ended December 31, 2015 primarily due to a $2.2 million increase in private event revenues and packaged round and beverage offers to The Players Club members, partially offset by a $1.0 million decrease from lease terminations in 2016.
Operating Expenses
There was no significant change in operating expenses during the year ended December 31, 2016 as compared to the year ended December 31, 2015.
Cost of Sales - Food and Beverages
Cost of sales decreased by $1.0 million during the year ended December 31, 2016 as compared to the year ended December 31, 2015 primarily due to (i) a $0.8 million decrease as a result of increased vendor rebates in 2016, (ii) a $0.4 million decrease from lease terminations in 2016, partially offset by (iii) a $0.2 million increase due to additional food and beverage sales.
General and Administrative Expense (including Acquisition and Transaction Expense)
General and administrative expense increased by $1.8 million during the year ended December 31, 2016 as compared to the year ended December 31, 2015 primarily due to: (i) $1.6 million in costs related to the development of Entertainment Golf and in the year ended December 31, 2016 compared to the year ended December 31, 2015 and (ii) a $0.2 million increase in professional fees incurred related to the golf financing obtained in June 2016 as compared to the financing obtained in August 2015.
Management Fee to Affiliate
There was no significant change in management fee to affiliate during the year ended December 31, 2016 as compared to the year ended December 31, 2015.
Depreciation and Amortization
Depreciation and amortization decreased by $2.1 million during the year ended December 31, 2016 as compared to the year ended December 31, 2015 primarily due to certain assets being fully depreciated in 2015 and 2016 from scheduled lease expirations partially offset by an increase in depreciation from additional capital leases.
Impairment (Reversal)
Impairment decreased by $1.5 million during the year ended December 31, 2016 compared to the year ended December 31, 2015. During the year ended December 31, 2016 we recorded: (i) a $3.9 million valuation allowance on a corporate loan, (ii) a $0.2 million valuation allowance on two residential mortgage loans, (iii) a $0.1 million other-than-temporary impairment charge on a CMBS security, (iv) a $3.6 million impairment on one golf property when we reclassified the property to held-for-sale and (v) a $2.6 million impairment charge related to two golf properties. During the year ended December 31, 2015, we recorded: (i) a $5.2 million valuation allowance on a corporate loan, (ii) a $4.3 million valuation allowance on a mezzanine loan, (iii) a $2.0 million other-than-temporary impairment charge on two CMBS securities and (iv) a $0.4 million other-than-temporary impairment charge on one equity security.
Realized/Unrealized (Gain) Loss on Investments
The realized/unrealized (gain) loss on investments increased by $22.9 million during the year ended December 31, 2016 as compared to the year ended December 31, 2015. During the year ended December 31, 2016, we recorded: (i) an $8.3 million loss on the sale of Agency RMBS, (ii) a $10.7 million gain on the sale of CDO bonds, (iii) a $0.5 million gain on non-Agency RMBS and (iv) an $18.3 million gain associated with the settlement of derivatives. We also recorded a $1.2 million unrealized gain associated with derivatives and a $23.1 million unrealized loss on Agency RMBS due to a change to an intent to sell. During the year ended December 31, 2015, we recorded: (i) a $28.8 million gain on the sale of CMBS and non-Agency RMBS, (ii) a $3.7 million gain on the sale of Agency RMBS, (iii) a $1.5 million gain on the sale of real estate related loans and (iv) a $13.5 million loss associated with the settlement of derivatives. We also recorded a $1.8 million unrealized gain associated with derivatives.
Interest and Investment Income
Interest and investment income decreased by $4.6 million during the year ended December 31, 2016 as compared to the year ended December 31, 2015 primarily due to: (i) a $5.7 million net decrease as a result of the sales and pay downs of real estate related loans in CDOs VI, VIII and IX, (ii) an $11.5 million decrease as a result of the sales and pay downs of real estate securities in CDOs VI, VIII and IX and (iii) a decrease of $3.2 million as a result of lower notional on our subprime mortgage loan call option. These were offset by: (i) a $1.4 million increase related to additional paid in kind (“PIK”) interest earned on corporate loans, (ii) a $10.5 million increase primarily related to accretion income recognized from a pay down of the resorts-related loan and (iii) a $3.9 million increase due to additional purchases of Agency RMBS.
Interest Expense
Interest expense decreased by $9.3 million during the year ended December 31, 2016 as compared to the year ended December 31, 2015 primarily due to: (i) a $1.6 million decrease in swap interest expense as there were no interest rate swaps in 2016, (ii) a $5.6 million decrease as a result of the golf debt that was repurchased in August 2015, (iii) a $4.4 million decrease due to lower balances of CDO bonds payable, (iv) a $3.2 million decrease as a result of lower notional on the financing of our subprime mortgage loan call option and (v) a $1.6 million decrease as a result of a lower weighted average coupon on the junior subordinated notes payable. These were offset by: (i) a $0.3 million increase due to the financing of the golf debt that was repurchased in August 2015, (ii) a $2.5 million increase due to higher financing costs and borrowing amounts incurred on repurchase agreements on the Agency RMBS, (iii) a $4.0 increase due to the refinancing of the golf debt in June 2016 and (iv) a $0.3 million increase due to interest expense on new capital leases.
Gain (Loss) on Extinguishment of Debt
The gain on extinguishment of debt decreased by $16.1 million during the year ended December 31, 2016 compared to the year ended December 31, 2015 due to: $0.8 million recorded during the year ended December 31, 2016 related to the write-off of traditional golf liabilities. The gain on extinguishment of debt of $15.3 million recorded during the year ended December 31, 2015 is due to: (i) $15.4 million gain related to the repurchase of the first and second lien golf debt from a third party in August 2015, (ii) $0.5 million gain related to the repurchase of CDO bonds payable in June 2015, offset by $0.6 million of losses associated with the write-off of traditional golf liabilities.
Gain on Deconsolidation
The gain on deconsolidation of $82.1 million during the year ended December 31, 2016 is related to the deconsolidation of CDO VI. There were no deconsolidations during the year ended December 31, 2015.
Other Income (Loss), Net
Other loss, net decreased by $2.5 million during the year ended December 31, 2016 as compared to the year ended December 31, 2015 primarily due to a $1.7 million decrease on our real estate related loans in 2015 and a decrease of $0.8 million related to the Traditional Golf business.
|
| | | | | | | | | | | | | | |
Comparison of Results of Operations for the years ended December 31, 2015 and 2014 |
| | | | | | | |
| Year Ended December 31, | | Increase (Decrease) |
| 2015 | | 2014 | | Amount | | % |
Revenues | | | | | | | |
Golf course operations | $ | 224,419 |
| | $ | 222,983 |
| | $ | 1,436 |
| | 0.6 | % |
Sales of food and beverages | 71,437 |
| | 68,554 |
| | 2,883 |
| | 4.2 | % |
Total revenues | 295,856 |
| | 291,537 |
| | 4,319 |
| | 1.5 | % |
| | | | | | | |
Operating costs | | | | | | | |
Operating expenses | 254,553 |
| | 263,338 |
| | (8,785 | ) | | (3.3 | )% |
Cost of sales - food and beverages | 22,549 |
| | 21,037 |
| | 1,512 |
| | 7.2 | % |
General and administrative expense | 12,037 |
| | 15,851 |
| | (3,814 | ) | | (24.1 | )% |
Management fee to affiliate | 10,692 |
| | 21,039 |
| | (10,347 | ) | | (49.2 | )% |
Depreciation and amortization | 28,634 |
| | 26,967 |
| | 1,667 |
| | 6.2 | % |
Impairment (reversal) | 11,896 |
| | (2,419 | ) | | 14,315 |
| | N.M |
|
Realized/unrealized (gain) loss on investments | (22,264 | ) | | (69,593 | ) | | (47,329 | ) | | (68.0 | )% |
Total operating costs | 318,097 |
| | 276,220 |
| | 41,877 |
| | 15.2 | % |
Operating income (loss) | (22,241 | ) | | 15,317 |
| | (37,558 | ) | | (245.2 | )% |
| | | | | | | |
Other income (expenses) | | | | | | | |
Interest and investment income | 95,891 |
| | 127,627 |
| | (31,736 | ) | | (24.9 | )% |
Interest expense | (62,129 | ) | | (80,022 | ) | | (17,893 | ) | | (22.4 | )% |
Gain (loss) on extinguishment of debt | 15,306 |
| | (3,410 | ) | | 18,716 |
| | N.M |
|
Other income (loss), net | (5,574 | ) | | 8,279 |
| | (13,853 | ) | | (167.3 | )% |
Total other income | 43,494 |
| | 52,474 |
| | (8,980 | ) | | (17.1 | )% |
| | | | | | | |
Income from continuing operations before income tax | $ | 21,253 |
| | $ | 67,791 |
| | $ | (46,538 | ) | | (68.6 | )% |
Golf Course Operations
Golf course operations increased by $1.4 million during the year ended December 31, 2015 compared to the year ended December 31, 2014 primarily due to: (i) a $3.9 million increase from the introduction of The Players Club program which increased driving range revenues at public golf properties, (ii) a $1.6 million increase in annual member fees partially offset by (iii) a $3.8 million decrease in greens and cart fees resulting from lease terminations in 2014 and (iv) a $0.3 million decrease due to reductions in merchandise sales and other club revenues resulting from lease terminations in 2014 and 2015.
Sales of Food and Beverages
Sales of food and beverages increased by $2.9 million during the year ended December 31, 2015 compared to the year ended December 31, 2014 primarily due to increases in private event revenues and new marketing programs offering various all-inclusive packages at certain traditional golf properties, partially offset by reductions from lease terminations in 2014 and 2015.
Operating Expenses
Operating expenses decreased by $8.8 million during the year ended December 31, 2015 compared to the year ended December 31, 2014 due to: (i) a $2.0 million decrease of payroll expense as a result of lease terminations in 2014 and 2015, (ii) a $2.7 million decrease of utilities expense primarily as a result of water restrictions across courses in California, (iii) a $3.3 million decrease in rent expense primarily due to lease terminations in 2014 and 2015, (iv) a $0.5 million decrease in operating lease expenses as a result of fewer operating leases and more capital leases, and (v) a $0.3 million decrease of property insurance expenses as a result of lease terminations in 2014 and 2015.
Cost of Sales - Food and Beverages
Cost of sales increased by $1.5 million during the year ended December 31, 2015 compared to the year ended December 31, 2014 primarily due to increased purchasing associated with new marketing programs offering various all-inclusive packages at certain traditional golf properties.
General and Administrative Expense (including Acquisition and Transaction Expense)
General and administrative expense decreased by $3.8 million during the year ended December 31, 2015 compared to the year ended December 31, 2014 primarily due to a decrease of $2.9 million in transaction related expenses and a decrease of $0.9 million in loan and security servicing expense due to the pay down and sale of securities and loans in our CDOs and the sale of the manufactured housing and residential whole loan portfolios in 2014.
Management Fee to Affiliate
Management fees decreased by $10.3 million during the year ended December 31, 2015 compared to the year ended December 31, 2014 primarily due to decreases in gross equity as a result of the New Media spin-off in February 2014 and the New Senior spin-off in November 2014. This was partially offset by an increase in gross equity as a result of our public offerings of common stock in August 2014.
Depreciation and Amortization
Depreciation and amortization expense increased by $1.7 million during the year ended December 31, 2015 compared to the year ended December 31, 2014 primarily due to the write-off of intangible liabilities resulting from traditional golf property lease terminations and lease modifications in 2014.
Impairment (Reversal)
Impairment increased by $14.3 million during the year ended December 31, 2015 compared to the year ended December 31, 2014 primarily due to: (i) a $12.8 million increase in valuation allowances related to our real estate related loans offset by a $0.9 million decrease in allowances related to our manufactured housing and residential mortgage loan portfolios. We also recorded other-than-temporary impairments of $2.0 million on two debt securities and $0.4 million on one equity security during the year ended December 31, 2015. We did not record other-than-temporary impairment during the year ended December 31, 2014.
Realized/Unrealized (Gain) Loss on Investments
The realized/unrealized gain on investments decreased by $47.3 million during the year ended December 31, 2015 compared to the year ended December 31, 2014. During the year ended December 31, 2015, we recorded a gain of $28.8 million on the sale of CMBS and non-Agency RMBS, a gain of $3.7 million on the sale of Agency RMBS, and a gain of $1.5 million on the sale of real estate related loans. This was offset by $13.5 million of losses associated with the settlement of derivatives in the year ended December 31, 2015. During the year ended December 31, 2015, we also recognized an unrealized gain of $1.8 million associated with the mark-to-market on derivatives. During the year ended December 31, 2014, we recorded a gain of $32.5 million related to the sale of our manufactured housing loan portfolio and residential whole loans portfolio, and a gain of $23.7 million on the sale of debt securities, offset by $4.2 million of losses associated with the settlement of derivatives. During the year ended December 31, 2014, we also recorded an unrealized gain of $12.5 million associated with income recognized on linked transactions and an unrealized gain of $5.1 million on derivatives.
Interest and Investment Income
Interest and investment income decreased by $31.7 million during the year ended December 31, 2015 compared to the year ended December 31, 2014 primarily due to: (i) a $16.0 million net decrease as a result of the sales and pay downs of real estate related loans in CDOs VIII and IX, (ii) an $8.9 million decrease as a result of the sale of the manufactured housing and residential mortgage loan portfolios during 2014, (iii) a decrease of $19.2 million due to the sale and pay downs of securities in our CDOs during 2014 and 2015, and (iv) a decrease of $0.5 million related to income recognized on the subprime mortgage loans subject to call option. These were offset by an increase of $8.7 million related to the addition of Agency RMBS and an increase of $4.2 million related to additional PIK interest earned on two real estate related loans.
Interest Expense
Interest expense decreased by $17.9 million during the year ended December 31, 2015 compared to the year ended December 31, 2014 primarily due to: (i) a $10.0 million decrease in swap interest expense due to a lower notional balance in 2015 compared to 2014, (ii) a $2.4 million decrease in the other debt segment primarily due to the payoff of the debt following the sale of the manufactured housing and residential mortgage loan portfolio in May 2014, (iii) a $5.6 million decrease in the CDO segment due
to pay downs of debt as a result of pay downs and sales of assets, (iv) a decrease of $1.1 million primarily due to repurchase of the golf debts in August 2015, and (v) a decrease of $0.5 million related to expenses recognized on the subprime mortgage loans subject to call option. This was offset by (i) an increase of $1.1 million due to higher balances of repurchase agreements financing the Agency RMBS portfolio, (ii) an increase of $0.4 million related to higher capital lease financing costs associated with the Traditional Golf business, and (iii) a $0.2 million increase related to higher interest accretion expense related to the traditional golf membership deposit liabilities.
Gain (Loss) on Extinguishment of Debt
The gain on extinguishment of debt of $15.3 million recorded during the year ended December 31, 2015 is due to (i) $15.4 million gain related to the repurchase of the first and second lien golf debt from a third party in August 2015, (ii) $0.5 million gain related to the repurchase of CDO bonds payable in June 2015, offset by $0.6 million of losses associated with the write-off of traditional golf liabilities. The loss on extinguishment of debt of $3.4 million during the year ended December 31, 2014 relates to the write-off of the unamortized discount on the manufactured housing debt upon the sale of the portfolio and the payoff of the debt in May 2014.
Other Income (Loss), Net
Other income decreased by $13.9 million during the year ended December 31, 2015 compared to the year ended December 31, 2014 primarily due to: (i) a $6.8 million decrease primarily related to gains recognized in 2014 on a lease modification related to a traditional golf property, (ii) a $7.1 million decrease in equity in earnings in equity method investees, (iii) a $0.5 million decrease related to deferred fee income recognized on the payoff of a real estate related loan in January 2014, (iv) a $0.3 million decrease related to fees from servicing third party CDOs and (v) a $0.7 million decrease related to various other traditional golf income items in 2015. This was partially offset by (i) a $0.5 million increase related to receipt of funds in 2015 related to the sale of the manufactured housing loan portfolio in May 2014 and (ii) a $1.0 million increase related to receipts on real estate related loans.
Traditional Golf Segment Results
Comparison of Traditional Golf Results of Operations for the years ended December 31, 2016 and 2015
|
| | | | | | | | | | | | | | |
| Year Ended December 31, | | Increase (Decrease) |
| 2016 | | 2015 | | Amount | | % |
Revenues | | | | | | | |
Golf course operations | $ | 226,255 |
| | $ | 224,419 |
| | $ | 1,836 |
| | 0.8 | % |
Sales of food and beverages | 72,625 |
| | 71,437 |
| | 1,188 |
| | 1.7 | % |
Total revenues | 298,880 |
| | 295,856 |
| | 3,024 |
| | 1.0 | % |
|
|
| |
|
| |
| |
|
Operating costs | | | | |
| |
|
Operating expenses | 254,353 |
| | 254,553 |
| | (200 | ) | | (0.1 | )% |
Cost of sales - food and beverages | 21,593 |
| | 22,549 |
| | (956 | ) | | (4.2 | )% |
General and administrative expense | 4,302 |
| | 4,347 |
| | (45 | ) | | (1.0 | )% |
Depreciation and amortization | 26,496 |
| | 28,682 |
| | (2,186 | ) | | (7.6 | )% |
Impairment (reversal) | 6,232 |
| | — |
| | 6,232 |
| | N.M. |
|
Realized/unrealized (gain) loss on investments | (294 | ) | | 9 |
| | (303 | ) | | N.M. |
|
Total operating costs | 312,682 |
| | 310,140 |
| | 2,542 |
| | 0.8 | % |
Operating income (loss) | (13,802 | ) | | (14,284 | ) | | 482 |
| | 3.4 | % |
| | | | | | | |
Other income (expenses) | | | | | | | |
Interest and investment income | 134 |
| | 152 |
| | (18 | ) | | (11.8 | )% |
Interest expense | (12,470 | ) | | (13,515 | ) | | (1,045 | ) | | (7.7 | )% |
Gain (loss) on extinguishment of debt | (780 | ) | | 14,818 |
| | (15,598 | ) | | (105.3 | )% |
Other income (loss), net | (2,379 | ) | | (1,629 | ) | | (750 | ) | | (46.0 | )% |
Total other income (expenses) | (15,495 | ) | | (174 | ) | | (15,321 | ) | | N.M. |
|
| | | | |
| |
|
Loss from continuing operations before income tax | $ | (29,297 | ) | | $ | (14,458 | ) | | $ | (14,839 | ) | | (102.6 | )% |
N.M. – Not meaningful
Golf Course Operations
Golf course operations increased by $1.8 million during the year ended December 31, 2016 compared to the year ended December 31, 2015 primarily due to: (i) a $5.5 million increase in net driving range revenues at public golf properties as a result of the continued growth of The Players Club program, (ii) a $2.0 million increase due to additional initiation fees from new member sales and higher membership dues rates, partially offset by (iii) a $3.4 million decrease in green fee and cart rental revenue as a result of unfavorable conditions, especially in California, (iv) a $1.9 million decrease in greens and cart fees and merchandise sales from lease terminations in 2016 and (v) a $0.4 million decrease in sales of merchandise due to unfavorable conditions, especially in California.
Sales of Food and Beverages
Sales of food and beverages increased by $1.2 million during the year ended December 31, 2016 compared to the year ended December 31, 2015 primarily due to a $2.2 million increase in private event revenues and packaged round and beverage offers to The Players Club members, partially offset by a $1.0 million decrease from lease terminations in 2016.
Operating Expenses
There was no significant change in operating expenses during the year ended December 31, 2016 compared to the year ended December 31, 2015.
Cost of Sales - Food and Beverages
Cost of sales decreased by $1.0 million during the year ended December 31, 2016 compared to the year ended December 31, 2015 primarily due to: (i) a $0.8 million decrease as a result of increased vendor rebates in 2016, (ii) a $0.4 million decrease from lease terminations in 2016, partially offset by (iii) a $0.2 million increase due to additional food and beverage sales.
General and Administrative Expense (including Acquisition and Transaction Expense)
There was no significant change in general and administrative expense during the year ended December 31, 2016 compared to the year ended December 31, 2015.
Depreciation and Amortization
Depreciation and amortization decreased by $2.2 million during the year ended December 31, 2016 compared to the year ended December 31, 2015 primarily due to certain assets being fully depreciated in 2015 and 2016 from scheduled lease expirations partially offset by an increase in depreciation from additional capital leases.
Impairment (Reversal)
Impairment increased by $6.2 million during the year ended December 31, 2016 compared to the year ended December 31, 2015 due to a $3.6 million impairment on one golf property when we reclassified the property to held-for-sale and a $2.6 million impairment charge related to two golf properties.
Realized/Unrealized (Gain) Loss on Investments
Realized/unrealized gain on investments increased by $0.3 million during the year ended December 31, 2016 compared to the year ended December 31, 2015 due to a gain recorded on the interest rate cap on our golf term loan.
Interest and Investment Income
There was no significant change in interest and investment income during the year ended December 31, 2016 compared to the year ended December 31, 2015.
Interest Expense
Interest expense decreased by $1.0 million during the year ended December 31, 2016 compared to the year ended December 31, 2015 primarily due to: (i) a $5.6 million decrease from the golf debt that was repurchased in August 2015, partially offset by (ii) a $4.0 million increase related to the golf refinancing obtained in June 2016, (iii) a $0.3 million increase due to the August 2015 golf repurchase agreement and (iv) a $0.3 million increase in capital lease interest due to additional capital leases.
Gain (Loss) on Extinguishment of Debt
Gain (loss) on extinguishment of debt decreased by $15.6 million during the year ended December 31, 2016 compared to the year ended December 31, 2015 primarily due to the gain on extinguishment of debt recorded related to the acquisition of the first and second lien golf debt at a discount in August 2015.
Other Income (Loss), net
Other loss, net increased by $0.8 million during the year ended December 31, 2016 compared to the year ended December 31, 2015 primarily due to: (i) a $2.7 million increase related to lease disposition costs incurred in 2016 partially offset by (ii) a $0.6 million decrease in construction-in-progress write-offs in 2016, (iii) a $0.5 million decrease in other liability write-offs in 2016, (iv) a $0.5 million decrease in intangible write-offs in 2016 and (v) a $0.4 million decrease in prepaid expense write-offs in 2016.
Comparison of Traditional Golf Results of Operations for the years ended December 31, 2015 and 2014
|
| | | | | | | | | | | | | | |
| Year Ended December 31, | | Increase (Decrease) |
| 2015 | | 2014 | | Amount | | % |
Revenues | | | | | | | |
Golf course operations | $ | 224,419 |
| | $ | 222,983 |
| | $ | 1,436 |
| | 0.6 | % |
Sales of food and beverages | 71,437 |
| | 68,554 |
| | 2,883 |
| | 4.2 | % |
Total revenues | 295,856 |
| | 291,537 |
| | 4,319 |
| | 1.5 | % |
|
| |
| |
| |
|
Operating costs | | | | | | | |
Operating expenses | 254,553 |
| | 263,338 |
| | (8,785 | ) | | (3.3 | )% |
Cost of sales - food and beverages | 22,549 |
| | 21,037 |
| | 1,512 |
| | 7.2 | % |
General and administrative expense | 4,347 |
| | 3,376 |
| | 971 |
| | 28.8 | % |
Depreciation and amortization | 28,682 |
| | 26,880 |
| | 1,802 |
| | 6.7 | % |
Realized/unrealized (gain) loss on investments | 9 |
| | — |
| | 9 |
| | N.M. |
|
Total operating costs | 310,140 |
| | 314,631 |
| | (4,491 | ) | | (1.4 | )% |
Operating income (loss) | (14,284 | ) | | (23,094 | ) | | 8,810 |
| | 38.1 | % |
| | | | | | | |
Other income (expenses) | | | | | | | |
Interest and investment income | 152 |
| | 147 |
| | 5 |
| | 3.4 | % |
Interest expense | (13,515 | ) | | (14,049 | ) | | (534 | ) | | (3.8 | )% |
Gain on extinguishment of debt | 14,818 |
| | — |
| | 14,818 |
| | N.M. |
|
Other income (loss), net | (1,629 | ) | | 5,863 |
| | (7,492 | ) | | (127.8 | )% |
Total other income (expenses) | (174 | ) | | (8,039 | ) | | 7,865 |
| | 97.8 | % |
| | | | | | | |
Loss from continuing operations before income tax | $ | (14,458 | ) | | $ | (31,133 | ) | | $ | 16,675 |
| | 53.6 | % |
N.M. – Not meaningful
Golf Course Operations
Golf course operations increased by $1.4 million during the year ended December 31, 2015 compared to the year ended December 31, 2014 primarily due to: (i) a $3.9 million increase from the introduction of The Players Club program which increased driving range revenues at public golf properties, (ii) a $1.6 million increase in annual member fees partially offset by (iii) a $3.8 million decrease in greens and cart fees resulting from lease terminations in 2014 and (iv) a $0.3 million decrease due to reductions in merchandise sales and other club revenues resulting from lease terminations in 2014 and 2015.
Sales of Food and Beverages
Sales of food and beverages increased by $2.9 million during the year ended December 31, 2015 compared to the year ended December 31, 2014 primarily due to increases in private event revenues and new marketing programs offering various all-inclusive packages at certain traditional golf properties, partially offset by reductions from lease terminations in 2014 and 2015.
Operating Expenses
Operating expenses decreased by $8.8 million during the year ended December 31, 2015 compared to the year ended December 31, 2014 due to: (i) a $2.0 million decrease of payroll expense as a result of lease terminations in 2014 and 2015, (ii) a $2.7 million decrease of utilities expense primarily as a result of water restrictions across courses in California, (iii) a $3.3 million decrease in rent expense primarily due to lease terminations in 2014 and 2015, (iv) a $0.5 million decrease in operating lease expenses as a result of fewer operating leases and more capital leases, and (v) a $0.3 million decrease of property insurance expenses as a result of lease terminations in 2014 and 2015.
Cost of Sales - Food and Beverages
Cost of sales increased by $1.5 million during the year ended December 31, 2015 compared to the year ended December 31, 2014 primarily due to increased purchasing associated with new marketing programs offering various all-inclusive packages at certain traditional golf properties.
General and Administrative Expense (including Acquisition and Transaction Expense)
General and administrative expense increased by $1.0 million during the year ended December 31, 2015 compared to the year ended December 31, 2014 primarily due to non-recurring professional fees incurred related to the acquisition of the first and second lien golf debt in 2015.
Depreciation and Amortization
Depreciation and amortization increased by $1.8 million during the year ended December 31, 2015 compared to the year ended December 31, 2014 primarily due to the write-off of intangible liabilities resulting from traditional golf property lease terminations and lease modifications in 2014.
Realized/Unrealized (Gain) Loss on Investments
There was no significant change in realized/unrealized (gain) loss on investments during the year ended December 31, 2015 compared to the year ended December 31, 2014.
Interest and Investment Income
There was no significant change in interest and investment income during the year ended December 31, 2015 compared to the year ended December 31, 2014.
Interest Expense
Interest expense decreased by $0.5 million during the year ended December 31, 2015 compared to the year ended December 31, 2014 primarily due to (i) a $2.5 million decrease from the golf debt that was repurchased in August 2015, partially offset by, (ii) a $1.5 million increase due to the August 2015 golf repurchase agreement (iii) a $0.4 million increase in capital lease interest due to additional capital leases and (iv) $0.2 million increase related to higher interest accretion expense related to the golf membership deposit liabilities.
Gain (Loss) on Extinguishment of Debt
We recorded gain on extinguishment of debt of $14.8 million during the year ended December 31, 2015 related to the acquisition of the first and second lien golf debt at a discount in 2015. There was no gain on extinguishment of debt recorded during the year ended December 31, 2014.
Other Income (Loss), net
Other income, net decreased by $7.5 million during the year ended December 31, 2015 compared to the year ended December 31, 2014 primarily due to gains on golf property lease terminations and modifications in 2014.
Liquidity and Capital Resources
Overview
Liquidity is a measurement of our ability to meet potential cash requirements, including ongoing commitments to repay borrowings, fund and maintain investments, fund capital for our Traditional and Entertainment Golf businesses, and other general business needs.
Our primary sources of funds for liquidity consist of net cash provided by operating activities, sales or repayments of investments, potential refinancing of existing debt, potential issuance of new debt or equity securities, when feasible. We have the ability to publicly or privately issue common stock, preferred stock, depository shares, debt securities and warrants. Our debt obligations are generally secured directly by our investment assets, except for the junior subordinated notes payable.
Sources of Liquidity and Uses of Capital
As of the date of this filing, we believe we have sufficient liquid assets, which include unrestricted cash, to satisfy all of our short-term recourse liabilities. Our junior subordinated notes payable are long-term obligations. With respect to the next 12 months, we expect that our cash on hand combined with our other primary sources of funds for liquidity will be sufficient to satisfy our anticipated liquidity needs with respect to our current portfolio, including related financings, capital expenditures for our Traditional and Entertainment golf businesses, working capital needs, potential margin calls and operating expenses. In addition, we may have additional cash requirements with respect to incremental investments related to our Traditional Golf business and executing our strategic objectives for our Entertainment Golf business. In addition to our available cash, we may elect to meet the cash requirements of these incremental investments through proceeds from the monetization of our assets or from additional borrowings or equity offerings. While it is inherently more difficult to forecast beyond the next 12 months, we currently expect to meet our long-term liquidity requirements, specifically the repayment of our recourse debt obligations, through our cash on hand and, if needed, additional borrowings, proceeds from equity offerings and the liquidation or refinancing of our assets. We continually monitor market conditions for financing opportunities, and at any given time, we may enter into or pursue one or more of the transactions described above.
These short-term and long-term expectations are forward-looking and subject to a number of uncertainties and assumptions, which are described below under “–Factors That Could Impact Our Liquidity, Capital Resources and Capital Obligations” as well as Part I, Item 1A. “Risk Factors.” If our assumptions about our liquidity prove to be incorrect, we could be subject to a shortfall in liquidity in the future, and this shortfall may occur rapidly and with little or no notice, which would limit our ability to address the shortfall on a timely basis.
Cash flows provided by operations constitute a critical component of our liquidity. Essentially, our cash flows provided by operations is equal to (i) net cash flows received from our Traditional Golf business, plus (ii) the net cash flows from our Debt Investments that are not subject to mandatory debt repayment, including principal and sales proceeds, less (iii) traditional golf operating expenses, management fees, professional fees and insurance, less (iv) interest on the junior subordinated notes payable and less (v) preferred dividends.
Our cash flows provided by operations differs from our net income (loss) due to these primary factors: (i) accretion of discount or premium on our real estate securities and loans (including the accrual of interest payable at maturity) and deferred financing costs, (ii) amortization of favorable and unfavorable leasehold intangibles from the acquisition of the Traditional Golf business in December 2013, (iii) accretion of the golf membership deposit liabilities in interest expense, (iv) amortization of prepaid golf membership dues, (v) gains and losses from sales of assets, (vi) the valuation allowance recorded in connection with our loan assets, as well as other-than-temporary impairment on our securities, Traditional Golf business and other investments, (vii) unrealized gains or losses on our investments, (viii) non-cash gains or losses associated with our early extinguishment of debt, (ix) non-cash gains on deconsolidation, and (x) depreciation and amortization on our investments. Proceeds from the sale of assets which serve as collateral for our CDO financings, including gains thereon, are required to be retained in the CDO structure until the related bonds are retired and are, therefore, not available to fund current cash needs outside of these structures.
The sources of our distributions are net cash provided by operating activities, net cash provided by investing activities and cash equivalents as they represent the return on our portfolio of investments in real estate debt and golf related real estate and operations. The Company has paid common dividends of $32.0 million and preferred dividends of $5.6 million in fiscal year 2016. However, our board of directors elected not to pay a common stock dividend in the first quarter of 2017 to retain capital for growth. For the year ended December 31, 2016, the Company reported net cash provided by operating activities of $3.4 million, net cash used in investing activities of $152.6 million, net cash provided by financing activities of $243.8 million and cash and cash equivalents of $140.1 million as of December 31, 2016. Prior to termination of our REIT election, we made distributions of a minimum of 90% of our taxable income each year in order to maintain our REIT status. As a result of our revocation of REIT election, effective January 1, 2017, we are no longer subject to the distribution requirements applicable to REITs. The timing and amount of distributions are in the sole discretion of our board of directors, which considers our earnings, financial performance and condition, debt service obligations and applicable debt covenants, tax considerations, as well as capital expenditure requirements, business prospects and other factors that our board of directors may deem relevant from time to time.
Update on Liquidity, Capital Resources and Capital Obligations
Cash – As of December 31, 2016, we had $140.1 million of available cash, including $18.3 million of working capital for the Traditional Golf business. On December 7, 2016, we declared a quarterly dividend of $9.4 million which was paid on January 31, 2017.
Certain details regarding our liquidity, current financings and capital obligations as of February 22, 2017 are set forth below:
Margin Exposure and Recourse Financings – We have margin exposure on a $595.4 million repurchase agreements related to the financing of FNMA/FHLMC securities. The mezzanine note payable was repaid in April 2016 and golf loans repurchase agreement was repaid in June 2016. See Note 11 to Part II, Item 8. “Financial Statements and Supplementary Data” for additional information.
The following table compares our recourse financings excluding the junior subordinated notes (in thousands):
|
| | | | | | | | | | | | |
Recourse Financings | | February 22, 2017 | | December 31, 2016 | | December 31, 2015 |
FNMA/FHLMC securities | | 595,371 |
| | 600,964 |
| | 348,625 |
|
Golf loans repurchase agreement | | — |
| | — |
| | 70,000 |
|
Mezzanine note payable | | — |
| | — |
| | 11,660 |
|
Total recourse financings | | $ | 595,371 |
| | $ | 600,964 |
| | $ | 430,285 |
|
Our liquidity, available capital resources and capital obligations could change rapidly due to a variety of factors, many of which are beyond our control. Set forth below is a discussion of some of the factors that could impact our liquidity, available capital resources and capital obligations.
Factors That Could Impact Our Liquidity, Capital Resources and Capital Obligations
We refer readers to our discussions in other sections of this report for the following information:
| |
• | For a further discussion of recent trends and events affecting our liquidity, see “– Market Considerations” above; |
| |
• | As described above, under “– Update on Liquidity, Capital Resources and Capital Obligations,” we are subject to margin calls in connection with our repurchase agreements; |
| |
• | As described above, under “– Sources of Liquidity and Uses of Capital,” we may be subject to capital obligations associated with our Traditional and Entertainment Golf businesses; |
| |
• | Our remaining investments, generally financed with short-term debt or short-term repurchase agreements, are also subject to refinancing risk upon the maturity of the related debt. See “– Debt Obligations” below; and |
| |
• | For a further discussion of a number of risks that could affect our liquidity, access to capital resources and our capital obligations, see Part I, Item 1A. “Risk Factors” above. |
In addition to the information referenced above, the following factors could affect our liquidity, access to capital resources and our capital obligations related to our Traditional and Entertainment Golf businesses. As such, if their outcomes do not fall within our expectations, changes in these factors could negatively affect our liquidity.
| |
• | Access to Financing from Counterparties – Decisions by investors, counterparties and lenders to enter into transactions with us will depend upon a number of factors, such as our historical and projected financial performance, compliance with the terms of our current credit and derivative arrangements, industry and market trends, the availability of capital and our investors’, counterparties’ and lenders’ policies and rates applicable thereto, and the relative attractiveness of alternative investment or lending opportunities. Our business strategy is dependent upon our investments at rates that provide a positive net spread. |
| |
• | Impact of Expected Repayment or Forecasted Sale on Cash Flows – The timing of and proceeds from the repayment or sale of certain investments may be different than expected or may not occur as expected. Proceeds from sales of assets in the current illiquid market environment are unpredictable and may vary materially from their estimated fair value and their carrying value. |
Debt Obligations
Certain of the debt obligations are obligations of our consolidated subsidiaries which own the related collateral. In some cases, such collateral is not available to other creditors of ours.
The financing of our Traditional Golf business contain various customary loan covenants, including certain coverage ratios. We were in compliance with all of the covenants in these financings as of December 31, 2016. In addition, as of December 31, 2016, we had complied with the general investment guidelines adopted by our board of directors that limit total leverage.
See Note 11 to Part II, Item 8. “Financial Statements and Supplementary Data” for further information related to our debt obligations and contractual maturities as of December 31, 2016.
Repurchase Agreements
The following table provides additional information regarding short-term borrowings (dollars in thousands). The outstanding short-term borrowings were used to finance certain of our investments in FNMA/FHLMC securities and to finance the acquisition of Golf debt. All of the repurchase agreements have full recourse to Drive Shack Inc.
|
| | | | | | | | | | | | | | | | | | | | | | | | | | | | | | | | | | | | | | | | | | | | | | | |
| O/S Amount | Avg Daily Amount O/S | Maximum Amount O/S | Wtd Avg Interest Rate | | O/S Amount | Avg Daily Amount O/S | Maximum Amount O/S | Wtd Avg Interest Rate | | O/S Amount | Avg Daily Amount O/S | Maximum Amount O/S | Wtd Avg Interest Rate | | O/S Amount | Avg Daily Amount O/S | Maximum Amount O/S | Wtd Avg Interest Rate |
| As of | For the Three Months Ended | | As of | For the Three Months Ended | | As of | For the Three Months Ended | | As of | For the Three Months Ended |
| March 31, 2016 | | June 30, 2016 | | September 30, 2016 | | December 31, 2016 |
FNMA/FHLMC | $ | 352,049 |
| $ | 351,902 |
| $ | 353,535 |
| 0.68 | % | | $ | 361,085 |
| $ | 362,848 |
| $ | 366,433 |
| 0.65 | % | | $ | 831,741 |
| $ | 649,944 |
| $ | 835,364 |
| 0.69 | % | | $ | 600,964 |
| $ | 912,553 |
| $ | 1,397,799 |
| 0.79 | % |
Golf Loans | $ | 68,500 |
| $ | 69,621 |
| $ | 70,000 |
| 4.10 | % | | $ | — |
| $ | 65,879 |
| $ | 68,500 |
| 4.44 | % | | $ | — |
| $ | — |
| $ | — |
| N/A |
| | $ | — |
| $ | — |
| $ | — |
| N/A |
|
| | | | | | | | | | | | | | | | | | | |
| As of | For the Three Months Ended | | As of | For the Three Months Ended | | As of | For the Three Months Ended | | As of | For the Three Months Ended |
| March 31, 2015 | | June 30, 2015 | | September 30, 2015 | | December 31, 2015 |
FNMA/FHLMC | $ | 386,120 |
| $ | 386,136 |
| $ | 388,529 |
| 0.36 | % | | $ | 375,704 |
| $ | 382,196 |
| $ | 386,299 |
| 0.37 | % | | $ | 345,859 |
| $ | 517,599 |
| $ | 598,168 |
| 0.40 | % | | $ | 348,625 |
| $ | 349,825 |
| $ | 352,765 |
| 0.48 | % |
CDO Securities | $ | 35,683 |
| $ | 51,019 |
| $ | 55,894 |
| 1.82 | % | | $ | — |
| $ | 18,666 |
| $ | 35,683 |
| 1.82 | % | | $ | — |
| $ | — |
| $ | — |
| N/A |
| | $ | — |
| $ | — |
| $ | — |
| N/A |
|
Golf Loans | $ | — |
| $ | — |
| $ | — |
| N/A |
| | $ | — |
| $ | — |
| $ | — |
| N/A |
| | $ | 70,000 |
| $ | 23,587 |
| $ | 70,000 |
| 3.83 | % | | $ | 70,000 |
| $ | 70,000 |
| $ | 70,000 |
| 3.72 | % |
| | | | | | | | | | | | | | | | | | | |
| As of | For the Three Months Ended | | As of | For the Three Months Ended | | As of | For the Three Months Ended | | As of | For the Three Months Ended |
| March 31, 2014 | | June 30, 2014 | | September 30, 2014 | | December 31, 2014 |
FNMA/FHLMC | $ | — |
| $ | 129,137 |
| $ | 516,134 |
| 0.40 | % | | $ | — |
| $ | — |
| $ | — |
| N/A |
| | $ | — |
| $ | — |
| $ | — |
| N/A | | $ | 385,282 |
| $ | 204,340 |
| $ | 385,282 |
| 0.36 | % |
CDO Securities | $ | 49,500 |
| $ | 44,325 |
| $ | 49,500 |
| 1.81 | % | | $ | 79,712 |
| $ | 52,380 |
| $ | 79,712 |
| 1.80 | % | | $ | 63,804 |
| $ | 71,701 |
| $ | 91,752 |
| 1.80 | % | | $ | 55,894 |
| $ | 63,265 |
| $ | 63,804 |
| 1.80 | % |
Linked transaction | $ | 54,250 |
| $ | 58,385 |
| $ | 60,646 |
| 1.66 | % | | $ | — |
| $ | 36,046 |
| $ | 58,563 |
| 1.65 | % | | $ | — |
| $ | — |
| $ | — |
| N/A |
| | $ | — |
| $ | — |
| $ | — |
| N/A |
|
Residential Mortgage Loans | $ | 25,363 |
| $ | 25,154 |
| $ | 25,363 |
| 2.16 | % | | $ | 22,965 |
| $ | 23,613 |
| $ | 25,363 |
| 2.15 | % | | $ | — |
| $ | 250 |
| $ | 22,965 |
| 2.15 | % | | $ | — |
| $ | — |
| $ | — |
| N/A |
|
O/S - Outstanding
In January 2014, we sold $503.0 million face amount of the FNMA/FHLMC securities for total proceeds of $532.2 million and repaid $516.1 million of repurchase agreements. We also financed additional repurchased CDO debt with $30.8 million of repurchase agreements. In June 2014, we repaid $60.0 million of repurchase agreements associated with our linked transaction as the underlying assets were paid off. Additionally, in June 2014 we financed previously repurchased CDO debt with $26.3 million of repurchase agreements. In July 2014, we sold $37.4 million face amount of residential mortgage loans for total proceeds of $34.7 million and repaid $23.0 million of repurchase agreements associated with these loans.
See Note 5 to Part II, Item 8. “Financial Statements and Supplementary Data” for information about the FNMA/FHLMC repurchase agreement activity for the years ended December 31, 2016 and 2015. See Note 11 to Part II, Item 8. “Financial Statements and Supplementary Data” for information about the CDO securities and Golf Loans repurchase agreement activity for the years ended December 31, 2016 and 2015.
The weighted average differences between the fair value of the assets and the face amount of financing of the FNMA/FHLMC repurchase agreements was 4% as of December 31, 2016.
Subprime Securitization
In March 2006, we acquired a portfolio of subprime mortgage loans (“Subprime Portfolio I”) for $1.50 billion. In April 2006, Newcastle Mortgage Securities Trust 2006-1 (“Securitization Trust 2006”) closed on a securitization of Subprime Portfolio I. We do not consolidate Securitization Trust 2006. We sold Subprime Portfolio I to Securitization Trust 2006, which issued $1.45 billion of notes with a stated maturity of March 2036. We, as holder of the equity of Securitization Trust 2006, have the option to redeem the notes once the aggregate principal balance of Subprime Portfolio I is equal to or less than 20% of such balance at the date of the transfer. The transaction between us and Securitization Trust 2006 qualified as a sale for accounting purposes. However, 20% of the loans which are subject to a call option by us, were not treated as being sold. Following the securitization, we held the following interests in Subprime Portfolio I: (i) the equity of Securitization Trust 2006, (ii) the retained notes, and (iii) subprime mortgage loans subject to call option and related financing in the amount of 100% of such loans (we note that this interest is non-economic if we do not exercise the option, meaning that it has no impact on us).
In March 2007, we entered into an agreement to acquire a portfolio of subprime mortgage loans (“Subprime Portfolio II”) with up to $1.7 billion of unpaid principal balance. In July 2007, Newcastle Mortgage Securities Trust 2007-1 (“Securitization Trust 2007”) closed on a securitization of Subprime Portfolio II. As a result of the repurchase of delinquent loans by the seller, as well as borrower repayments, the unpaid principal balance of the portfolio upon securitization was $1.1 billion. We do not consolidate Securitization Trust 2007. We sold Subprime Portfolio II to Securitization Trust 2007, which issued $1.0 billion of notes with a stated maturity of April 2037. We, as holder of the equity of Securitization Trust 2007, have the option to redeem the notes once the aggregate principal balance of Subprime Portfolio II is equal to or less than 10% of such balance at the date of the transfer. The transaction between us and Securitization Trust 2007 qualified as a sale for accounting purposes. However, 10% of the loans which are subject to a call option by us were not treated as being sold. Following the securitization, we held the following interests in Subprime Portfolio II: (i) the equity of Securitization Trust 2007, (ii) the retained notes, and (iii) subprime mortgage loans subject to call option and related financing in the amount of 100% of such loans (we note that this interest is non-economic, meaning that if we do not exercise the option it has no impact on us).
We have no obligation to repurchase any loans from either of our subprime securitizations. Therefore, it is expected that our exposure to loss is limited to the carrying amount of our retained interests in the securitization entities, as described above. A subsidiary of Drive Shack Inc. gave limited representations and warranties with respect to Subprime Portfolio II; however, it has no assets and does not have recourse to the Company's assets.
On December 29, 2016, the Company sold the call option to a third party and, as a result of this sale, the loans subject to call option and corresponding financing are no longer reported on Drive Shack Inc.'s Consolidated Balance Sheet. See Note 6 to Part II, Item 8. “Financial Statements and Supplementary Data” for additional information.
Subordinated Notes Payable
The following table presents certain information regarding the junior subordinated notes (dollars in thousands).
|
| | | | |
Outstanding face amount |
| $51,004 |
| |
Weighted average coupon | LIBOR + 2.25% |
| |
Maturity | April 2035 |
| |
|
| |
Collateral | General credit of Drive Shack Inc. |
Golf Credit Facilities and Repurchase Agreement
See Note 11 to Part II, Item 8. “Financial Statements and Supplementary Data” for information about our golf credit facilities and repurchase agreement.
Equity
Common Stock
See Note 12 to Part II, Item 8. “Financial Statements and Supplementary Data” for information on shares of our common stock issued since 2014.
Common Dividends Paid
|
| | | | |
Declared for the Period Ended | | Paid | | Amount Per Share (A) |
March 31, 2014 | | April 2014 | | $0.60 |
June 30, 2014 | | July 2014 | | $0.60 |
September 30, 2014 | | October 2014 | | $0.60 |
December 31, 2014 | | January 2015 | | $0.12 |
March 31, 2015 | | April 2015 | | $0.12 |
June 30, 2015 | | July 2015 | | $0.12 |
September 30, 2015 | | October 2015 | | $0.12 |
December 31, 2015 | | January 2016 | | $0.12 |
March 31, 2016 | | April 2016 | | $0.12 |
June 30, 2016 | | July 2016 | | $0.12 |
September 30, 2016 | | October 2016 | | $0.12 |
December 31, 2016 | | January 2017 | | $0.12 |
| |
(A) | On February 13, 2014, we completed the spin-off of New Media through a distribution of shares valued at $5.34 per Drive Shack Inc. share (calculated by multiplying the fair market value of $73.80 per New Media share by the spin-off conversion ratio of 0.0722). On November 6, 2014, we completed the spin-off of New Senior through a distribution of shares valued at $18.02 per share. |
See Note 12 to Part II, Item 8. “Financial Statements and Supplementary Data” for detailed information on our options outstanding and option plans.
Preferred Stock
To the extent we have unpaid accrued dividends on our preferred stock, we cannot pay any dividends on our common shares, pay any consideration to repurchase or otherwise acquire stock of our common stock or redeem any stock of any series of our preferred stock without redeeming all of our outstanding preferred stock in accordance with the governing documentation. Moreover, if we do not pay dividends on any series of preferred stock for six or more periods, then holders of each affected series obtain the right to call a special meeting and elect two members to our board of directors. Consequently, if we do not make a dividend payment on our preferred stock for six or more quarterly periods, it could restrict the actions that we may take with respect to our common stock and preferred stock and could affect the composition of our board of directors and, thus, the management of our business. No assurance can be given that we will pay any dividends on any series of our preferred stock in the future.
All accrued dividends on our preferred stock have been paid through January 31, 2017.
See Note 12 to Part II, Item 8. “Financial Statements and Supplementary Data” for additional information on our preferred stock.
Noncontrolling Interest
Noncontrolling interest represents the equity interest in certain consolidated subsidiaries not owned by Drive Shack Inc. Noncontrolling interest is reported as a component of equity. In addition, changes in Drive Shack Inc.’s ownership interest while the Company retains its controlling interest are accounted for as equity transactions, and, upon a gain or loss of control, retained ownership interests are remeasured at fair value, with any gain or loss recognized in earnings.
Drive Shack Inc.’s noncontrolling interest is related to our Traditional Golf business, a portion of which the Company does not own. In October 2016, we exited certain golf properties in which the Company had a noncontrolling interest. The noncontrolling interest associated with the remaining golf property has a carrying value of zero.
Accumulated Other Comprehensive Income (Loss)
During the year ended December 31, 2016 our accumulated other comprehensive income (loss) changed due to the following factors (in thousands):
|
| | | | | | | | | | | |
| Gains/ Losses on Cash Flow Hedges | | Gains / Losses on Securities | | Total Accumulated Other
Comprehensive Income (Loss) |
Accumulated other comprehensive income (loss), December, 31, 2015 | $ | 20 |
| | $ | 33,277 |
| | $ | 33,297 |
|
Net unrealized loss on available for sale securities | — |
| | (31,658 | ) | | (31,658 | ) |
Reclassification of net realized/unrealized loss on securities into earnings | — |
| | 20,231 |
| | 20,231 |
|
Reclassification of net realized gain on deconsolidation of CDO VI | — |
| | (20,682 | ) | | (20,682 | ) |
Reclassification of net realized loss on derivatives designated as cash flow hedges into earnings | (20 | ) | | — |
| | (20 | ) |
Accumulated other comprehensive income (loss), December 31, 2016 | $ | — |
| | $ | 1,168 |
| | $ | 1,168 |
|
Our GAAP equity changes as our real estate securities portfolio and derivatives are marked to market each quarter, among other factors. The primary causes of mark-to-market changes are changes in interest rates. Net unrealized gains on our real estate securities decreased during the year ended December 31, 2016 in accumulated other comprehensive income primarily as a result of gains recognized in earnings from the deconsolidation of CDO VI and net unrealized losses on our fixed rate Agency RMBS caused by rising interest rates towards the end of the year ended December 31, 2016. These were partially offset by net losses realized in earnings that were primarily driven by the reclassification of unrealized losses into earnings on Agency RMBS due to the Company’s intent to sell these securities.
See “– Market Considerations” above for a further discussion of recent trends and events affecting our unrealized gains and losses as well as our liquidity.
Cash Flow
Operating Activities
Net cash flow (used in) provided by operating activities changed from $(2.6) million for the year ended December 31, 2015 to $3.4 million for the year ended December 31, 2016. It changed from $37.5 million for the year ended December 31, 2014 to $(2.6) million for the year ended December 31, 2015. These changes resulted primarily from the factors described below:
2016 compared to 2015
| |
• | Operating cash flows from Traditional Golf increased by $8.5 million primarily due to: (i) the continued growth of the driving range program at public golf properties, (ii) decreased interest expense payments as a result of the golf debt repurchased in August 2015, (iii) increased food and beverage sales due to increased private events and (iv) decreased operating expenses as a result of the termination of certain leased traditional golf properties in 2015. |
| |
• | A decrease of approximately $3.3 million in corporate general and administrative expenses paid during the year ended December 31, 2016 compared to the year ended December 31, 2015 primarily due to expenses incurred at the end of 2014 that were paid in the first quarter of 2015 associated with the spin-off of New Senior Investment Group Inc. An increase of $1.1 million in general and administrative expenses paid for Entertainment Golf. |
| |
• | A decrease of approximately $1.2 million in interest expense as a result of lowering interest rates associated with the junior subordinated notes payable for the year ended December 31, 2016 compared to the year ended December 31, 2015. |
| |
• | Net cash receipts from our Debt Investments portfolio decreased by $5.9 million for the year ended December 31, 2016 compared to the year ended December 31, 2015 primarily due to lower interest proceeds as a result of the liquidation CDO VIII and IX in June 2015 and the sale of a real estate related loan in April 2016. |
2015 compared to 2014
| |
• | Operating cash flows from Traditional Golf increased by $6.9 million primarily due to (i) increased sales of food and beverage from private events, (ii) the introduction of a new driving range program at public golf properties, and (iii) decreased operating expenses as a result of the termination of certain leased golf properties in 2014. |
| |
• | A decrease of approximately $5.6 million in general and administrative expenses paid during the year ended December 31, 2015 compared to the year ended December 31, 2014 due to fewer transaction related expenses primarily due to the spin-off of New Senior. |
| |
• | Management fees paid decreased approximately $11.6 million for the year ended December 31, 2015 compared to the year ended December 31, 2014 due to a decrease in gross equity as a result of the spin-offs of New Media in February 2014 and New Senior in November 2014 which was partially offset by an increase in gross equity as a result of the public offerings of our common stock in August 2014. |
| |
• | Net cash receipts from CDOs in our Debt Investments portfolio decreased approximately $10.8 million for the year ended December 31, 2015 compared to the year ended December 31, 2014 primarily due to lower interest proceeds from CDO VIII and IX, as a result of pay downs and sales in 2014 and 2015. |
| |
• | Net cash receipts from other debt portfolios in our Debt Investments portfolio increased by approximately $9.1 million primarily due to an increase of approximately $9.8 million of net receipts on our FNMA/FHLMC securities and approximately $1.7 million of receipts from our unencumbered securities and loans, offset by a decrease of approximately $2.4 million in net receipts from the manufactured housing loan portfolios that were sold in May 2014. |
| |
• | Increase of $1.5 million as a result of net cash used from New Media, which was spun-off in February 2014. |
| |
• | Reduction of $64.0 million as a result of the spin-off of New Senior in November 2014. |
Investing Activities
Investing activities used $152.6 million, provided $193.1 million, and provided $319.9 million during the years ended December 31, 2016, 2015 and 2014, respectively. Uses of cash flows from investing activities consisted primarily of the investments made in traditional golf properties, entertainment golf venues, real estate securities and senior housing properties. Proceeds from cash flows from investing activities consisted primarily of sale of investments, repayments from loans and securities, settlement of derivatives and return of restricted cash from investing activities.
Financing Activities
Financing activities provided $243.8 million, used $218.7 million, and used $389.4 million during the years December 31, 2016, 2015 and 2014, respectively. The public offerings of common stock, borrowings under debt obligations, the return of margin deposits under repurchase agreements and derivatives, and deposits received on golf memberships served as the primary sources of cash flow from financing activities. Uses of cash flow from financing activities included the repayment of debt obligations, the repurchase of debt, the contribution of cash to New Media and New Senior upon the spin-offs, deposits made on margin calls related to our repurchase agreements and derivatives, the payment of financing costs, the payment of common and preferred dividends, payments related to the settlement of derivatives, and the payment of costs related to the common stock offerings.
See the Consolidated Statements of Cash Flows in our Consolidated Financial Statements included in “Financial Statements and Supplementary Data” for a reconciliation of our cash position for the periods described herein.
Interest Rate, Credit and Spread Risk
We are subject to interest rate, credit and spread risk with respect to our investments. These risks are further described in Part II, Item 7A. “Quantitative and Qualitative Disclosures About Market Risk.”
Off-Balance Sheet Arrangements
As of December 31, 2016, we had the following material off-balance sheet arrangements. We believe that these off-balance sheet structures presented the most efficient and least expensive form of financing for these assets at the time they were entered, and represented the most common market-accepted method for financing such assets.
| |
• | In April 2006, we securitized Subprime Portfolio I. The loans were sold to a securitization trust, of which 80% were treated as a sale, which is an off-balance sheet financing. |
| |
• | In July 2007, we securitized Subprime Portfolio II. The loans were sold to a securitization trust, of which 90% were treated as a sale, which is an off-balance sheet financing. |
We have no obligation to repurchase any loans from either of our subprime securitizations. Therefore, it is expected that our exposure to loss is limited to the carrying amount of our retained interests in the securitization entities, as described above. A subsidiary of ours gave limited representations and warranties with respect to the second securitization; however, it has no assets and does not have recourse to the general credit of Drive Shack Inc.
In each case, our exposure to loss is limited to the carrying value of our investment.
Contractual Obligations
As of December 31, 2016, we had the following material contractual obligations (payments in thousands):
|
| |
Contract | Terms |
Repurchase Agreements | Described under Note 11 to our Consolidated Financial Statements which appears under Part II, Item 8. “Financial Statements and Supplementary Data.” |
| |
Credit Facilities, Golf | Described under Note 11 to our Consolidated Financial Statements which appears under Part II, Item 8. “Financial Statements and Supplementary Data.” |
| |
Capital Leases, Golf | Described under Note 11 to our Consolidated Financial Statements which appears under Part II, Item 8. “Financial Statements and Supplementary Data.” |
| |
Junior Subordinated Notes Payable | Described under Note 11 to our Consolidated Financial Statements which appears under Part II, Item 8. “Financial Statements and Supplementary Data.” |
| |
Operating Leases | Described under Notes 2 and 14 to our Consolidated Financial Statements which appears under Part II, Item 8. “Financial Statements and Supplementary Data.” |
| |
Membership Deposit Liabilities | Described under Notes 2 and 14 to our Consolidated Financial Statements which appears under Part II, Item 8. “Financial Statements and Supplementary Data.” |
| |
Management Agreement | Our Manager is paid an annual management fee of 1.5% of our gross equity, as defined in the management agreement, an expense reimbursement, and incentive compensation equal to 25% of our adjusted net income available for common stockholders above a certain threshold. For more information on this agreement, as well as historical amounts earned, see Note 13 to Part II, Item 8. “Financial Statements and Supplementary Data.” As a result of not meeting the incentive compensation threshold, the incentive compensation to the Manager has been discontinued for an indeterminate period of time. |
| |
Trustee Agreements | We have entered into trustee agreements in connection with our securitized investments, primarily our CDOs. We pay annual fees of between 0.015% and 0.020% of the outstanding face amount of the CDO bonds under these agreements. |
|
| | | | | | | | | | | | | | | | | | | | |
| | Fixed and Determinable Payments Due by Period |
Contract | | 2017 | | 2018-2019 | | 2020-2021 | | Thereafter | | Total |
| | | | | | | | | | |
Repurchase agreements (A) | | $ | 600,964 |
| | $ | — |
| | $ | — |
| | $ | — |
| | $ | 600,964 |
|
Credit facilities, golf (B) | | 6,634 |
| | 111,954 |
| | 9 |
| | 297 |
| | 118,894 |
|
Capital leases, golf (B) | | 4,666 |
| | 9,173 |
| | 4,828 |
| | 158 |
| | 18,825 |
|
Junior subordinated notes payable (B) | | 1,657 |
| | 3,313 |
| | 3,313 |
| | 74,748 |
| | 83,031 |
|
Management agreement (C) | | 10,206 |
| | 20,412 |
| | 20,412 |
| | 255,150 |
| | 306,180 |
|
Operating lease obligations (D) | | 31,787 |
| | 53,804 |
| | 40,401 |
| | 130,284 |
| | 256,276 |
|
Membership deposit liabilities (E) | | 8,531 |
| | 879 |
| | 6,083 |
| | 230,604 |
| | 246,097 |
|
Loan servicing agreements | | * |
| | * |
| | * |
| | * |
| | * |
|
Trustee agreements | | * |
| | * |
| | * |
| | * |
| | * |
|
Total | | $ | 664,445 |
| | $ | 199,535 |
| | $ | 75,046 |
| | $ | 691,241 |
| | $ | 1,630,267 |
|
* These contracts do not have fixed and determinable payments.
| |
(A) | Repurchase agreements, which have not been term financed, and mature within one year of our financial statement date, are included in this table assuming no interest. |
| |
(B) | Includes interest based on rates existing at December 31, 2016 and assumes no prepayments. Obligations that are repayable prior to maturity at our option are reflected at their contractual maturity dates. |
| |
(C) | Amounts reflect base management fees for the next 30 years assuming no change in gross equity, as defined, from December 31, 2016. |
| |
(D) | Includes leases of golf courses and related facilities, carts and equipment. Excludes escalation charges which per our lease agreements are not fixed and determinable payments. Also excludes three month-to-month property leases which are cancellable by the parties with 30 days written notice and various month-to-month operating leases for carts and equipment. The aggregate monthly expense of these leases was $0.3 million. |
| |
(E) | Amounts represent gross initiation fee deposits refundable 30 years after the date of acceptance of a member. |
Inflation
For our assets and liabilities that are financial in nature, interest rates and other factors affect our performance more so than inflation, although inflation rates can often have a meaningful influence over the direction of interest rates. Furthermore, our financial statements are prepared in accordance with GAAP and our distributions are determined by our board of directors primarily based on our taxable income, and, in each case, our activities and balance sheet are measured with reference to historical cost and/or fair market value without considering inflation. See Part II, Item 7A. “Quantitative and Qualitative Disclosure About Market Risk — Interest Rate Exposure” below.
Core Earnings
The following primary variables impact our operating performance: (i) the current yield earned on our investments that are not included in non-recourse financing structures (i.e., unlevered investments, including investments in equity method investees and investments subject to recourse debt), (ii) the net yield we earn from our non-recourse financing structures, (iii) the interest expense and dividends incurred under our recourse debt and preferred stock, (iv) the net operating income on our real estate and golf investments, (v) our operating expenses and (vi) our realized and unrealized gains or losses, net of related provision for income taxes, including any impairment, on our investments, derivatives and debt obligations. Core earnings is a non-GAAP measure of our operating performance excluding the sixth variable listed above. Core earnings also excludes depreciation and amortization charges, including the accretion of membership deposit liabilities and the impact of the application of acquisition accounting, acquisition and spin-off related expenses and restructuring expenses. Core earnings is used by management to evaluate our performance without taking into account gains and losses, net of related provision for income taxes,which, although they represent a part of our recurring operations, are subject to significant variability and are only a potential indicator of future performance. These adjustments to our income applicable to common stockholders are not indicative of the performance of the assets that form the core of our activity. Management utilizes core earnings as a measure in its decision-making process relating to the underlying fundamental operations of our investments, as well as the allocation of resources between those investments, and management also relies on core earnings as an indicator of the results of such decisions. As such, core earnings is not intended to reflect all of our activity and should be considered as only one of the factors in assessing our performance, along with GAAP net income, which is inclusive of all of our activities. Management also believes that the exclusion from core earnings of the items specified above allows investors and analysts to readily identify and track the operating performance of the assets that form the core of our activity, assists in comparing the core operating results between periods, and enables investors to evaluate our current core performance using the same measure that management uses to operate the business.
Core earnings does not represent an alternative to net income as an indicator of our operating performance or as an alternative to cash flows from operating activities as a measure of our liquidity, and is not indicative of cash available to fund cash needs. For a further description of the differences between cash flows provided by operations and net income, see “– Liquidity and Capital Resources” above. Our calculation of core earnings may be different from the calculation used by other companies and, therefore, comparability may be limited.
Set forth below is a reconciliation of core earnings to the most directly comparable GAAP financial measure (in thousands).
|
| | | | | | | | | | | |
| Year Ended December 31, |
| 2016 | | 2015 | | 2014 |
Income applicable to common stockholders | $ | 71,499 |
| | $ | 16,267 |
| | $ | 27,666 |
|
Add (deduct): | | | | | |
Impairment (reversal) | 10,381 |
| | 11,896 |
| | (2,419 | ) |
Realized/unrealized (gain) loss on investments | 685 |
| | (22,264 | ) | | (69,593 | ) |
Other (income) (A) | (76,760 | ) | | (8,274 | ) | | (995 | ) |
Impairment (reversal), other (income) loss and other adjustments from discontinued operations (B) | — |
| | (307 | ) | | 104,226 |
|
Depreciation and amortization (C) | 36,749 |
| | 39,416 |
| | 37,629 |
|
Acquisition, transaction, restructuring and spin-off related expenses (D) | 4,762 |
| | 1,391 |
| | 3,479 |
|
Core earnings | $ | 47,316 |
| | $ | 38,125 |
| | $ | 99,993 |
|
| |
(A) | Other income reconciliation: |
|
| | | | | | | | | | | |
| Year Ended December 31, |
| 2016 | | 2015 | | 2014 |
Total other income | $ | 116,699 |
| | $ | 43,494 |
| | $ | 52,474 |
|
Add (deduct): | | | | | |
Equity in earnings from equity method investees (E) | (1,516 | ) | | (1,311 | ) | | (954 | ) |
Interest and investment income | (91,291 | ) | | (95,891 | ) | | (127,627 | ) |
Interest expense | 52,868 |
| | 62,129 |
| | 80,022 |
|
Provision for income tax relating to gain on extinguishment of debt | — |
| | (147 | ) | | — |
|
Deal expenses related to the sale of the residential loan and manufactured housing portfolios | — |
| | — |
| | (2,920 | ) |
Other income | $ | 76,760 |
| | $ | 8,274 |
| | $ | 995 |
|
The deal expenses were recorded to general and administrative expense under GAAP during 2014.
| |
(B) | Includes gain on settlement of assets of $0.3 million during the year ended December 31, 2015. Includes depreciation and amortization of less than $0.1 million and $90.6 million (gross of $0 and $0.7 million) during the years ended December 31, 2015 and 2014, respectively. Includes acquisition and spin-off related expenses of $15.8 million and other (income) of ($1.4) million during the year ended December 31, 2014. |
| |
(C) | Including accretion of membership deposit liabilities of $5.8 million, $5.8 million and $5.7 million, and amortization of favorable and unfavorable leasehold intangibles of $4.5 million, $4.9 million and $5.0 million during the years ended December 31, 2016, 2015 and 2014, respectively. The accretion of membership deposit liabilities was recorded to interest expense and the amortization of favorable and unfavorable leasehold intangibles was recorded to operating expenses. |
| |
(D) | Including acquisition and transaction expenses of $4.4 million, $1.1 million and $2.6 million and restructuring expenses of $0.4 million, $0.3 million and $0.9 million during the years ended December 31, 2016, 2015 and 2014, respectively. The acquisition and transaction expenses were recorded to general and administrative expense and restructuring expenses were recorded to operating expenses. |
| |
(E) | Equity in earnings from equity method investees excludes impairment of $2.9 million. and $7.5 million during the years ended December 31, 2016 and 2015, respectively. There was no impairment reported during the year ended December 31, 2014. |
Item 7A. Quantitative and Qualitative Disclosures About Market Risk
Market risk is the exposure to loss resulting from changes in interest rates, credit spreads, foreign currency exchange rates, commodity prices and equity prices. The primary market risks that we are exposed to are interest rate risk and credit spread risk. These risks are highly sensitive to many factors, including governmental monetary and tax policies, domestic and international economic and political considerations and other factors beyond our control. All of our market risk sensitive assets, liabilities and derivative positions are for non-trading purposes only. For a further understanding of how market risk may effect our financial position or operating results, please refer to Part II, Item 7. “Management’s Discussion and Analysis of Financial Condition and Results of Operations – Application of Critical Accounting Policies.”
Interest Rate Exposure
Changes in interest rates, including changes in expected interest rates or “yield curves,” affect our investments in two distinct ways, each of which is discussed below.
First, changes in interest rates affect our net interest income, which is the difference between the interest income earned on assets and the interest expense incurred in connection with our debt obligations and hedges.
We may use match funded structures, when appropriate and available. This means that we seek to match the maturities of our debt obligations with the maturities of our assets to reduce the risk that we have to refinance our liabilities prior to the maturities of our assets, and to reduce the impact of changing interest rates on our earnings. In addition, we seek to match fund interest rates on certain of our assets with like-kind debt (i.e., fixed rate assets are financed with fixed rate debt and floating rate assets are financed with floating rate debt), directly or through the use of interest rate swaps, caps or other financial instruments (see below), or through a combination of these strategies, which we believe allows us to reduce the impact of changing interest rates on our earnings.
However, increases in interest rates can nonetheless reduce our net interest income to the extent that we are not completely match funded.
Furthermore, a period of rising interest rates can negatively impact our return on certain floating rate investments. Although these investments may be financed with floating rate debt, the interest rate on the debt may reset prior to, and in some cases more frequently than, the interest rate on the assets, causing a decrease in return on equity during a period of rising interest rates. See Part II, Item 7. “Management’s Discussion and Analysis of Financial Condition and Results of Operations – Liquidity and Capital Resources – Update on Liquidity, Capital Resources and Capital Obligations” for information on related debt.
As of December 31, 2016, a 100 basis point increase in short-term interest rates would decrease our earnings by approximately $0.5 million per annum, based on the current net floating rate exposure from our investments, financings and interest rate derivatives.
Second, changes in the level of interest rates also affect the yields required by the marketplace on debt. Increasing interest rates would decrease the value of the fixed rate assets we hold at the time because higher required yields result in lower prices on existing fixed rate assets in order to adjust their yield upward to meet the market.
Changes in unrealized gains or losses resulting from changes in market interest rates do not directly affect our cash flows, or our ability to pay a dividend, as the related assets are expected to be held, as their fair value is not relevant to their underlying cash flows. Changes in unrealized gains or losses would impact our ability to realize gains on existing investments if they were sold. Furthermore, with respect to changes in unrealized gains or losses on investments which are carried at fair value, changes in unrealized gains or losses would impact our net book value and, in the cases of impaired assets and non-hedge derivatives, our net income.
Changes in the value of our assets could affect our ability to borrow and access capital. Also, if the value of our assets subject to short-term financing were to decline, it could cause us to fund margin and affect our ability to refinance such assets upon the maturity of the related financings, adversely impacting our rate of return on such securities.
As of December 31, 2016, a 100 basis point change in short-term interest rates would impact our net book value by approximately $0.2 million, based on the current net fixed rate exposure from our investments and interest rate derivatives.
An interest rate cap or floor agreement is a contract in which we purchase a cap or floor contract on a notional face amount. We will make an upfront payment to the counterparty for which the counterparty agrees to make future payments to us should the reference rate (typically LIBOR) rise above (cap agreements) or fall below (floor agreements) the “strike” rate specified in the
contract. Payments on an annualized basis will equal the contractual notional face amount multiplied by the difference between the actual reference rate and the contracted strike rate.
While a REIT may utilize these types of derivative instruments to hedge interest rate risk on its liabilities or for other purposes, such derivative instruments could generate income that is not qualified income for purposes of maintaining REIT status. As a consequence, in prior periods, we engaged in such instruments to hedge such risks within the constraints of maintaining our standing as a REIT.
Our hedging transactions using derivative instruments also involve certain additional risks such as counterparty credit risk, the enforceability of hedging contracts and the risk that unanticipated and significant changes in interest rates will cause a significant loss of basis in the contract. There can be no assurance that we will be able to adequately protect against the foregoing risks and will ultimately realize an economic benefit that exceeds the related amounts incurred in connection with engaging in such hedging strategies.
Credit Spread Exposure
Credit spreads measure the yield demanded on loans and securities by the market based on their credit relative to U.S. Treasuries, for fixed rate credit, or LIBOR, for floating rate credit. Our fixed rate loans and securities are valued based on a market credit spread over the rate payable on fixed rate U.S. Treasuries of like maturity. Our floating rate loans and securities are valued based on a market credit spread over LIBOR. Excessive supply of such loans and securities combined with reduced demand will generally cause the market to require a higher yield on such loans and securities, resulting in the use of a higher (or “wider”) spread over the benchmark rate to value them.
Widening credit spreads would result in higher yields being required by the marketplace on loans and securities. This widening would reduce the value of the loans and securities we hold at the time because higher required yields result in lower prices on existing securities in order to adjust their yield upward to meet the market. The effects of such a decrease in values on our financial position, results of operations and liquidity are discussed above under “- Interest Rate Exposure.”
As of December 31, 2016, a 25 basis point movement in credit spreads would impact our net book value by approximately $0.1 million, assuming a static portfolio of current investments and financings, but would not directly affect our earnings or cash flow.
Our financing strategy is dependent on our ability to place the match funded debt we use to finance our investments at rates that provide a positive net spread. Currently, spreads for such liabilities have widened and demand for such liabilities has become extremely limited, therefore restricting our ability to execute future financings.
In an environment where spreads are tightening, if spreads tighten on the assets we purchase to a greater degree than they tighten on the liabilities we issue, our net spread will be reduced.
Credit Risk
In addition to the above described market risks, the Company is subject to credit risk.
Credit risk refers to the ability of each individual borrower under our loans and securities to make required interest and principal payments on the scheduled due dates. The commercial mortgage and asset backed securities we invest in are generally junior in right of payment of interest and principal to one or more senior classes, but benefit from the support of one or more subordinate classes of securities or other form of credit support (which absorbs losses before the securities in which we invest) within a securitization transaction. We also invest in loans and securities which represent “first loss” pieces; in other words, they do not benefit from credit support although we believe at acquisition they predominantly benefit from underlying collateral value in excess of their carrying amounts. Corporate loans are also subject to the risk of a bankruptcy filing of the related entity.
We seek to reduce credit risk by actively monitoring our asset portfolio and the underlying credit quality of our holdings and, where appropriate and achievable, repositioning our investments to upgrade their credit quality. In the event of a significant rising interest rate environment and/or economic downturn, loan and collateral defaults may increase and result in credit losses that would adversely affect our liquidity and operating results. As described in “Management’s Discussion and Analysis of Financial Condition and Result of Operations – Market Considerations” and elsewhere in this Annual Report, adverse market and credit conditions have resulted in our recording of other-than-temporary impairment and valuation allowance in certain securities and loans.
Margin
We are subject to margin calls on our repurchase agreements and derivative agreements. Furthermore, we may, from time to time, be a party to other financing arrangements that are subject to margin calls based on the value of such instruments. We seek to maintain adequate cash reserves and other sources of available liquidity to meet any margin calls resulting from decreases in value related to a reasonably possible (in the opinion of management) change in interest rates.
Interest Rate and Credit Spread Risk Sensitive Instruments and Fair Value
Our holdings of such financial instruments, and their fair values and the estimation methodology thereof, are detailed in Note 10 to Part II, Item 8. “Financial Statements and Supplementary Data.” For information regarding the impact of prepayment, reinvestment, and expected loss factors on the timing of realization of our investments, please refer to the Consolidated Financial Statements included therein. For information regarding the impact of changes in these factors on the value of securities valued with internal models, see Part II, Item 7. “Management’s Discussion and Analysis of Financial Condition and Results of Operations – Application of Critical Accounting Policies.”
We note that the values of our investments in real estate securities, loans and derivative instruments are sensitive to changes in market interest rates, credit spreads and other market factors. The value of these investments can vary, and has varied, materially from period to period.
Trends
See Part II, Item 7. “Management’s Discussion and Analysis of Financial Condition and Results of Operations – Market Considerations” for a further discussion of recent trends and events affecting our liquidity, unrealized gains and losses.
Item 8. Financial Statements and Supplementary Data.
Index to Financial Statements:
Report of Independent Registered Public Accounting Firm.
Report on Internal Control Over Financial Reporting of Independent Registered Public Accounting Firm.
Consolidated Balance Sheets as of December 31, 2016 and December 31, 2015.
Consolidated Statements of Operations for the years ended December 31, 2016, 2015 and 2014.
Consolidated Statements of Comprehensive Income for the years ended December 31, 2016, 2015 and 2014.
Consolidated Statements of Equity for the years ended December 31, 2016, 2015 and 2014.
Consolidated Statements of Cash Flows for the years ended December 31, 2016, 2015 and 2014.
Notes to Consolidated Financial Statements.
All schedules have been omitted because either the required information is included in our Consolidated Financial Statements and notes thereto or it is not applicable.
Report of Independent Registered Public Accounting Firm
The Board of Directors and Stockholders of Drive Shack Inc. and Subsidiaries
We have audited the accompanying consolidated balance sheets of Drive Shack Inc. and Subsidiaries (the “Company”) as of December 31, 2016 and 2015, and the related consolidated statements of operations, comprehensive income, equity and cash flows for each of the three years in the period ended December 31, 2016. These financial statements are the responsibility of the Company's management. Our responsibility is to express an opinion on these financial statements based on our audits.
We conducted our audits in accordance with the standards of the Public Company Accounting Oversight Board (United States). Those standards require that we plan and perform the audit to obtain reasonable assurance about whether the financial statements are free of material misstatement. An audit includes examining, on a test basis, evidence supporting the amounts and disclosures in the financial statements. An audit also includes assessing the accounting principles used and significant estimates made by management, as well as evaluating the overall financial statement presentation. We believe that our audits provide a reasonable basis for our opinion.
In our opinion, the financial statements referred to above present fairly, in all material respects, the consolidated financial position of Drive Shack Inc. and Subsidiaries at December 31, 2016 and 2015, and the consolidated results of their operations and their cash flows for each of the three years in the period ended December 31, 2016, in conformity with U.S. generally accepted accounting principles.
We also have audited, in accordance with the standards of the Public Company Accounting Oversight Board (United States), Drive Shack Inc. and Subsidiaries’ internal control over financial reporting as of December 31, 2016, based on criteria established in Internal Control-Integrated Framework issued by the Committee of Sponsoring Organizations of the Treadway Commission (2013 framework) and our report dated March 2, 2017 expressed an unqualified opinion thereon.
/s/ Ernst & Young LLP
New York, New York
March 2, 2017
Report of Independent Registered Public Accounting Firm
The Board of Directors and Stockholders of Drive Shack Inc. and Subsidiaries
We have audited Drive Shack Inc. and Subsidiaries' internal control over financial reporting as of December 31, 2016, based on criteria established in Internal Control-Integrated Framework issued by the Committee of Sponsoring Organizations of the Treadway Commission (COSO) (2013 Framework). Drive Shack Inc. and Subsidiaries' management is responsible for maintaining effective internal control over financial reporting and for its assessment of the effectiveness of internal control over financial reporting included in the accompanying Management’s Report on Internal Control over Financial Reporting. Our responsibility is to express an opinion on the company's internal control over financial reporting based on our audit.
We conducted our audit in accordance with the standards of the Public Company Accounting Oversight Board (United States). Those standards require that we plan and perform the audit to obtain reasonable assurance about whether effective internal control over financial reporting was maintained in all material respects. Our audit included obtaining an understanding of internal control over financial reporting, assessing the risk that a material weakness exists, testing and evaluating the design and operating effectiveness of internal control based on the assessed risk, and performing such other procedures as we considered necessary in the circumstances. We believe that our audit provides a reasonable basis for our opinion.
A company’s internal control over financial reporting is a process designed to provide reasonable assurance regarding the reliability of financial reporting and the preparation of financial statements for external purposes in accordance with generally accepted accounting principles. A company’s internal control over financial reporting includes those policies and procedures that (1) pertain to the maintenance of records that, in reasonable detail, accurately and fairly reflect the transactions and dispositions of the assets of the company; (2) provide reasonable assurance that transactions are recorded as necessary to permit preparation of financial statements in accordance with generally accepted accounting principles, and that receipts and expenditures of the company are being made only in accordance with authorizations of management and directors of the company; and (3) provide reasonable assurance regarding prevention or timely detection of unauthorized acquisition, use, or disposition of the company’s assets that could have a material effect on the financial statements.
Because of its inherent limitations, internal control over financial reporting may not prevent or detect misstatements. Also, projections of any evaluation of effectiveness to future periods are subject to the risk that controls may become inadequate because of changes in conditions, or that the degree of compliance with the policies or procedures may deteriorate.
In our opinion, Drive Shack Inc. and Subsidiaries maintained, in all material respects, effective internal control over financial reporting as of December 31, 2016, based on the COSO criteria.
We also have audited, in accordance with the standards of the Public Company Accounting Oversight Board (United States), the consolidated balance sheets of Drive Shack Inc. and Subsidiaries as of December 31, 2016 and 2015, and the related consolidated statements of operations, comprehensive income, equity and cash flows for each of the three years in the period ended December 31, 2016 of Drive Shack Inc. and Subsidiaries and our report dated March 2, 2017 expressed an unqualified opinion thereon.
/s/ Ernst & Young LLP
New York, New York
March 2, 2017
DRIVE SHACK INC. AND SUBSIDIARIES
CONSOLIDATED BALANCE SHEETS
(dollars in thousands, except share data)
|
| | | | | | | |
| December 31, |
| 2016 | | 2015 |
Assets | | | |
Real estate securities, available-for-sale - Note 5 | $ | 1,950 |
| | $ | 59,034 |
|
Real estate securities, available-for-sale - pledged as collateral - Note 5 | 627,304 |
| | 105,963 |
|
Real estate related and other loans, held-for-sale, net - Note 6 | 55,612 |
| | 149,198 |
|
Subprime mortgage loans subject to call option - Note 6 | — |
| | 380,806 |
|
Investments in real estate, net of accumulated depreciation - Note 7 | 217,611 |
| | 227,907 |
|
Intangibles, net of accumulated amortization - Note 8 | 65,112 |
| | 74,472 |
|
Other investments | 19,256 |
| | 20,595 |
|
Cash and cash equivalents | 140,140 |
| | 45,651 |
|
Restricted cash | 6,404 |
| | 4,469 |
|
Receivables from brokers, dealers and clearing organizations | 552 |
| | 361,341 |
|
Receivables and other assets - Note 2 | 38,017 |
| | 38,546 |
|
Total Assets | $ | 1,171,958 |
| | $ | 1,467,982 |
|
| | | |
Liabilities and Equity | | | |
Liabilities | | | |
CDO bonds payable - Note 11 | $ | — |
| | $ | 92,933 |
|
Other bonds and notes payable - Note 11 | — |
| | 16,162 |
|
Repurchase agreements - Note 11 | 600,964 |
| | 418,458 |
|
Credit facilities and obligations under capital leases - Note 11 | 115,284 |
| | 11,258 |
|
Financing of subprime mortgage loans subject to call option - Note 6 | — |
| | 380,806 |
|
Junior subordinated notes payable - Note 11 | 51,217 |
| | 51,225 |
|
Dividends payable | 8,949 |
| | 8,929 |
|
Membership deposit liabilities | 89,040 |
| | 83,210 |
|
Payables to brokers, dealers and clearing organizations | — |
| | 105,940 |
|
Accounts payable, accrued expenses and other liabilities - Note 2 | 88,437 |
| | 88,939 |
|
Total Liabilities | $ | 953,891 |
| | $ | 1,257,860 |
|
| | | |
Commitments and contingencies - Notes 12, 13 and 14 |
|
| |
|
|
| | | |
Equity | | | |
Preferred stock, $0.01 par value, 100,000,000 shares authorized,
1,347,321 shares of 9.75% Series B Cumulative Redeemable Preferred Stock,
496,000 shares of 8.05% Series C Cumulative Redeemable Preferred Stock, and
620,000 shares of 8.375% Series D Cumulative Redeemable Preferred Stock, liquidation preference $25.00 per share, issued and outstanding as of December 31, 2016 and 2015 | $ | 61,583 |
| | $ | 61,583 |
|
Common stock, $0.01 par value, 1,000,000,000 shares authorized, 66,824,304 and 66,654,598 shares issued and outstanding at December 31, 2016 and 2015, respectively | 668 |
| | 667 |
|
Additional paid-in capital | 3,172,720 |
| | 3,172,370 |
|
Accumulated deficit | (3,018,072 | ) | | (3,057,538 | ) |
Accumulated other comprehensive income - Note 2 | 1,168 |
| | 33,297 |
|
Total Drive Shack Inc. Stockholders’ Equity | 218,067 |
| | 210,379 |
|
Noncontrolling interest | — |
| | (257 | ) |
Total Equity | $ | 218,067 |
| | $ | 210,122 |
|
| | | |
Total Liabilities and Equity | $ | 1,171,958 |
| | $ | 1,467,982 |
|
See notes to Consolidated Financial Statements.
DRIVE SHACK INC. AND SUBSIDIARIES
CONSOLIDATED STATEMENTS OF OPERATIONS
FOR THE YEARS ENDED DECEMBER 31, 2016, 2015 and 2014
(dollars in thousands, except share data)
|
| | | | | | | | | | | |
| Year Ended December 31, |
| 2016 | | 2015 | | 2014 |
Revenues | | | | | |
Golf course operations | $ | 226,255 |
| | $ | 224,419 |
| | $ | 222,983 |
|
Sales of food and beverages | 72,625 |
| | 71,437 |
| | 68,554 |
|
Total revenues | 298,880 |
| | 295,856 |
| | 291,537 |
|
| | | | | |
Operating costs | | | | | |
Operating expenses | 254,353 |
| | 254,553 |
| | 263,338 |
|
Cost of sales - food and beverages | 21,593 |
| | 22,549 |
| | 21,037 |
|
General and administrative expense | 13,842 |
| | 12,037 |
| | 15,851 |
|
Management fee to affiliate - Note 13 | 10,704 |
| | 10,692 |
| | 21,039 |
|
Depreciation and amortization | 26,496 |
| | 28,634 |
| | 26,967 |
|
Impairment (reversal) | 10,381 |
| | 11,896 |
| | (2,419 | ) |
Realized/unrealized (gain) loss on investments - Note 2 | 685 |
| | (22,264 | ) | | (69,593 | ) |
Total operating costs | 338,054 |
| | 318,097 |
| | 276,220 |
|
Operating income (loss) | (39,174 | ) | | (22,241 | ) | | 15,317 |
|
| | | | | |
Other income (expenses) | | | | | |
Interest and investment income | 91,291 |
| | 95,891 |
| | 127,627 |
|
Interest expense | (52,868 | ) | | (62,129 | ) | | (80,022 | ) |
Gain (loss) on extinguishment of debt | (780 | ) | | 15,306 |
| | (3,410 | ) |
Gain on deconsolidation - Note 2 | 82,130 |
| | — |
| | — |
|
Other income (loss), net - Note 2 | (3,074 | ) | | (5,574 | ) | | 8,279 |
|
Total other income (expenses) | 116,699 |
| | 43,494 |
| | 52,474 |
|
Income from continuing operations before income tax | 77,525 |
| | 21,253 |
| | 67,791 |
|
Income tax expense - Note 15 | 189 |
| | 345 |
| | 208 |
|
Income from continuing operations | 77,336 |
| | 20,908 |
| | 67,583 |
|
Income (loss) from discontinued operations, net of tax - Note 3 | — |
| | 646 |
| | (35,189 | ) |
Net Income | 77,336 |
| | 21,554 |
| | 32,394 |
|
Preferred dividends | (5,580 | ) | | (5,580 | ) | | (5,580 | ) |
Net (income) loss attributable to noncontrolling interest | (257 | ) | | 293 |
| | 852 |
|
Income Applicable To Common Stockholders | $ | 71,499 |
| | $ | 16,267 |
| | $ | 27,666 |
|
Continued on next page.
DRIVE SHACK INC. AND SUBSIDIARIES
CONSOLIDATED STATEMENTS OF OPERATIONS
FOR THE YEARS ENDED DECEMBER 31, 2016, 2015 and 2014
(dollars in thousands, except share data)
|
| | | | | | | | | | | |
| Year Ended December 31, |
| 2016 | | 2015 | | 2014 |
Income Applicable to Common Stock, per share | | | | | |
Basic | $ | 1.07 |
| | $ | 0.24 |
| | $ | 0.45 |
|
Diluted | $ | 1.04 |
| | $ | 0.24 |
| | $ | 0.44 |
|
| | | | | |
Income from Continuing Operations per share of Common Stock, after preferred dividends and noncontrolling interest | | | | | |
Basic | $ | 1.07 |
| | $ | 0.23 |
| | $ | 1.02 |
|
Diluted | $ | 1.04 |
| | $ | 0.23 |
| | $ | 1.00 |
|
| | | | | |
Income (loss) from Discontinued Operations per share of Common Stock | | | | | |
Basic | $ | — |
| | $ | 0.01 |
| | $ | (0.57 | ) |
Diluted | $ | — |
| | $ | 0.01 |
| | $ | (0.57 | ) |
| | | | | |
Weighted Average Number of Shares of Common Stock Outstanding | | | | | |
Basic | 66,709,925 |
| | 66,479,321 |
| | 61,500,913 |
|
Diluted | 68,788,440 |
| | 68,647,915 |
| | 63,131,227 |
|
See notes to Consolidated Financial Statements.
DRIVE SHACK INC. AND SUBSIDIARIES
CONSOLIDATED STATEMENTS OF COMPREHENSIVE INCOME
FOR THE YEARS ENDED DECEMBER 31, 2016, 2015 and 2014
(dollars in thousands)
|
| | | | | | | | | | | |
| Year Ended December 31, |
| 2016 | | 2015 | | 2014 |
Net income | $ | 77,336 |
| | $ | 21,554 |
| | $ | 32,394 |
|
Other comprehensive income (loss): | | | | | |
Net unrealized gain (loss) on available-for-sale securities | (31,658 | ) | | (1,868 | ) | | 8,953 |
|
Reclassification of net realized/unrealized (gain) loss on securities into earnings | 20,231 |
| | (32,537 | ) | | (23,679 | ) |
Reclassification of net realized gain on deconsolidation of CDO VI | (20,682 | ) | | — |
| | — |
|
Net unrealized loss on derivatives designated as cash flow hedges | — |
| | (60 | ) | | (177 | ) |
Reclassification of net realized (gain) loss on derivatives designated as cash flow hedges into earnings | (20 | ) | | 1,897 |
| | 4,352 |
|
Net unrecognized gain and pension prior service cost (discontinued operations) | — |
| | — |
| | 9 |
|
Other comprehensive income (loss) | (32,129 | ) | | (32,568 | ) | | (10,542 | ) |
Total comprehensive income (loss) | $ | 45,207 |
| | $ | (11,014 | ) | | $ | 21,852 |
|
Comprehensive income (loss) attributable to Drive Shack Inc. stockholders' equity | $ | 44,950 |
| | $ | (10,721 | ) | | $ | 22,704 |
|
Comprehensive income (loss) attributable to noncontrolling interest | $ | 257 |
| | $ | (293 | ) | | $ | (852 | ) |
See notes to Consolidated Financial Statements.
DRIVE SHACK INC. AND SUBSIDIARIES
CONSOLIDATED STATEMENTS OF EQUITY
FOR THE YEARS ENDED DECEMBER 31, 2016, 2015 and 2014
(dollars in thousands, except share data)
|
| | | | | | | | | | | | | | | | | | | | | | | | | | | | | | | | | | | | | |
| Drive Shack Inc. Stockholders | | | | | | |
| | | | | | | | | Accumulated
Other Comp.
Income
(Loss) | | Total Drive Shack Inc. Stockholders' Equity | | | | |
| | | | | | | | | Additional
Paid in
Capital | | | | | | | | Total
Equity
(Deficit) |
| Preferred Stock | | Common Stock | | | Accumulated
Deficit | | | | Noncontrolling
Interest | |
| Shares | | Amount | | Shares | | Amount | | | | | | |
Equity (deficit) - December 31, 2013 | 2,463,321 |
| | $ | 61,583 |
| | 58,575,582 |
| | $ | 586 |
| | $ | 2,973,715 |
| | $ | (1,947,913 | ) | | $ | 76,874 |
| | $ | 1,164,845 |
| | $ | 61,279 |
| | 1,226,124 |
|
Dividends declared | — |
| | — |
| | — |
| | — |
| | — |
| | (123,708 | ) | | — |
| | (123,708 | ) | | — |
| | (123,708 | ) |
Issuance of common stock | — |
| | — |
| | 7,848,926 |
| | 78 |
| | 198,345 |
| | — |
| | — |
| | 198,423 |
| | — |
| | 198,423 |
|
Spin-off of New Media | — |
| | — |
| | — |
| | — |
| | — |
| | (330,489 | ) | | (467 | ) | | (330,956 | ) | | (60,391 | ) | | (391,347 | ) |
Spin-off of New Senior | — |
| | — |
| | — |
| | — |
| | — |
| | (673,016 | ) | | — |
| | (673,016 | ) | | — |
| | (673,016 | ) |
Comprehensive income (loss) | | | | | | | | | | | | | | | | | | | |
Net income (loss) | — |
| | — |
| | — |
| | — |
| | — |
| | 33,246 |
| | — |
| | 33,246 |
| | (852 | ) | | 32,394 |
|
Other comprehensive loss | — |
| | — |
| | — |
| | — |
| | — |
| | — |
| | (10,542 | ) | | (10,542 | ) | | — |
| | (10,542 | ) |
Total comprehensive income (loss) | | | | | | | | | | | | | | | 22,704 |
| | (852 | ) | | 21,852 |
|
Equity (deficit) - December 31, 2014 | 2,463,321 |
| | $ | 61,583 |
| | 66,424,508 |
| | $ | 664 |
| | $ | 3,172,060 |
| | $ | (3,041,880 | ) | | $ | 65,865 |
| | $ | 258,292 |
| | $ | 36 |
| | $ | 258,328 |
|
Dividends declared | — |
| | — |
| | — |
| | — |
| | — |
| | (37,505 | ) | | — |
| | (37,505 | ) | | — |
| | (37,505 | ) |
Issuance of common stock | — |
| | — |
| | 230,090 |
| | 3 |
| | 310 |
| | — |
| | — |
| | 313 |
| | — |
| | 313 |
|
Comprehensive income (loss) | | | | | | | | | | | | | | | | | | | |
Net income (loss) | — |
| | — |
| | — |
| | — |
| | — |
| | 21,847 |
| | — |
| | 21,847 |
| | (293 | ) | | 21,554 |
|
Other comprehensive loss | — |
| | — |
| | — |
| | — |
| | — |
| | — |
| | (32,568 | ) | | (32,568 | ) | | — |
| | (32,568 | ) |
Total comprehensive loss | | | | | | | | | | | | | | | (10,721 | ) | | (293 | ) | | (11,014 | ) |
Equity (deficit) - December 31, 2015 | 2,463,321 |
| | $ | 61,583 |
| | 66,654,598 |
| | $ | 667 |
| | $ | 3,172,370 |
| | $ | (3,057,538 | ) | | $ | 33,297 |
| | $ | 210,379 |
| | $ | (257 | ) | | $ | 210,122 |
|
Dividends declared | — |
| | — |
| | — |
| | — |
| | — |
| | (37,613 | ) | | — |
| | (37,613 | ) | | — |
| | (37,613 | ) |
Issuance of common stock | — |
| | — |
| | 169,706 |
| | 1 |
| | 350 |
| | — |
| | — |
| | 351 |
| | — |
| | 351 |
|
Comprehensive income (loss) | | | | | | | | | | | | | | | | | | | |
Net income (loss) | — |
| | — |
| | — |
| | — |
| | — |
| | 77,079 |
| | — |
| | 77,079 |
| | 257 |
| | 77,336 |
|
Deconsolidation of net unrealized gain on securities | — |
| | — |
| | — |
| | — |
| | — |
| | — |
| | (20,682 | ) | | (20,682 | ) | | — |
| | (20,682 | ) |
Other comprehensive loss | — |
| | — |
| | — |
| | — |
| | — |
| | — |
| | (11,447 | ) | | (11,447 | ) | | — |
| | (11,447 | ) |
Total comprehensive income (loss) |
|
| | | | | | | | | | | | | | 44,950 |
| | 257 |
| | 45,207 |
|
Equity (deficit) - December 31, 2016 | 2,463,321 |
| | $ | 61,583 |
| | 66,824,304 |
| | $ | 668 |
| | $ | 3,172,720 |
| | $ | (3,018,072 | ) | | $ | 1,168 |
| | $ | 218,067 |
| | $ | — |
| | $ | 218,067 |
|
See notes to Consolidated Financial Statements.
DRIVE SHACK INC. AND SUBSIDIARIES
CONSOLIDATED STATEMENTS OF CASH FLOWS
FOR THE YEARS ENDED DECEMBER 31, 2016, 2015 and 2014
(dollars in thousands)
|
| | | | | | | | | | | |
| Year Ended December 31, |
| 2016 | | 2015 | | 2014 |
Cash Flows From Operating Activities | | | | | |
Net income | $ | 77,336 |
| | $ | 21,554 |
| | $ | 32,394 |
|
Adjustments to reconcile net income to net cash provided by (used in) operating activities (inclusive of amounts related to discontinued operations): | | | | | |
Depreciation and amortization | 26,496 |
| | 28,645 |
| | 117,594 |
|
Amortization of discount and premium | (6,445 | ) | | (2,555 | ) | | (14,482 | ) |
Other amortization | 10,254 |
| | 10,782 |
| | 10,663 |
|
Net interest income on investments accrued to principal balance | (28,886 | ) | | (27,246 | ) | | (20,386 | ) |
Amortization of revenue on golf membership deposit liabilities | (884 | ) | | (509 | ) | | (167 | ) |
Amortization of prepaid golf member dues | (28,902 | ) | | (29,558 | ) | | (28,071 | ) |
Valuation allowance (reversal) on loans | 4,039 |
| | 9,541 |
| | (2,419 | ) |
Other-than-temporary impairment on securities and other investments | 6,342 |
| | 2,355 |
| | — |
|
Change in fair value of contingent consideration | — |
| | — |
| | (1,500 | ) |
Straight-lining of rental income | — |
| | — |
| | (21,794 | ) |
Equity in loss (earnings) from equity method investees, net of distributions | 1,338 |
| | 6,194 |
| | (954 | ) |
Gain on deconsolidation | (82,130 | ) | | — |
| | — |
|
Gain on settlement of investments, net | (20,555 | ) | | (19,305 | ) | | (51,380 | ) |
Unrealized loss on securities, intent-to-sell | 23,128 |
| | — |
| | — |
|
Unrealized (gain) loss on non-hedge derivatives and hedge ineffectiveness | (1,222 | ) | | (1,758 | ) | | (17,565 | ) |
Loss (gain) on extinguishment of debt, net | 780 |
| | (15,306 | ) | | 3,410 |
|
Non-cash directors' compensation | 351 |
| | 313 |
| | 321 |
|
Change in: | | | | | |
Restricted cash | (6,828 | ) | | (2,344 | ) | | 1,464 |
|
Receivables and other assets | 595 |
| | (1,805 | ) | | (314 | ) |
Accounts payable, accrued expenses and other liabilities | 28,571 |
| | 18,361 |
| | 30,665 |
|
Net cash provided by (used in) operating activities | 3,378 |
| | (2,641 | ) | | 37,479 |
|
Cash Flows From Investing Activities | | | | | |
Principal repayments from investments | 150,459 |
| | 128,191 |
| | 245,447 |
|
Purchase of real estate securities | (3,086,654 | ) | | (1,409,693 | ) | | (404,638 | ) |
Proceeds from sale of investments | 2,777,808 |
| | 1,425,480 |
| | 798,580 |
|
Net proceeds from settlement of TBAs | 18,318 |
| | — |
| | — |
|
Acquisition and additions of investments in real estate | (12,571 | ) | | (7,637 | ) | | (315,454 | ) |
Funds reserved for future capital expenditures | — |
| | — |
| | (3,424 | ) |
Change in restricted cash from investing activities | — |
| | 56,774 |
| | — |
|
Deposits paid on investments | — |
| | — |
| | (655 | ) |
Net cash (used in) provided by investing activities | (152,640 | ) | | 193,115 |
| | 319,856 |
|
Continued on next page.
DRIVE SHACK INC. AND SUBSIDIARIES
CONSOLIDATED STATEMENTS OF CASH FLOWS
FOR THE YEARS ENDED DECEMBER 31, 2016, 2015 and 2014
(dollars in thousands)
|
| | | | | | | | | | | |
| Year Ended December 31, |
| 2016 | | 2015 | | 2014 |
Cash Flows From Financing Activities | | | | | |
Repurchases of debt obligations | — |
| | (152,281 | ) | | — |
|
Borrowings under debt obligations | 3,068,280 |
| | 1,966,666 |
| | 668,003 |
|
Repayments of debt obligations | (2,788,183 | ) | | (1,983,438 | ) | | (831,042 | ) |
Margin deposits under repurchase agreements and derivatives | (131,443 | ) | | (130,398 | ) | | (36,752 | ) |
Return of margin deposits under repurchase agreements and derivatives | 133,991 |
| | 128,430 |
| | 38,079 |
|
Golf membership deposits received | 3,865 |
| | 4,711 |
| | 3,518 |
|
Issuance of common stock | — |
| | — |
| | 198,702 |
|
Costs related to issuance of common stock | — |
| | — |
| | (595 | ) |
Contribution of cash upon spin-off | — |
| | — |
| | (269,091 | ) |
Common stock dividends paid | (32,011 | ) | | (31,897 | ) | | (145,299 | ) |
Preferred stock dividends paid | (5,580 | ) | | (5,580 | ) | | (5,580 | ) |
Payment of deferred financing costs | (4,248 | ) | | (754 | ) | | (4,592 | ) |
Net (payments) from settlement of derivative instruments | — |
| | (13,519 | ) | | (4,151 | ) |
Other financing activities | (920 | ) | | (625 | ) | | (617 | ) |
Net cash provided by (used in) financing activities | 243,751 |
| | (218,685 | ) | | (389,417 | ) |
Net Decrease in Cash and Cash Equivalents | 94,489 |
| | (28,211 | ) | | (32,082 | ) |
Cash and Cash Equivalents of Continuing Operations, Beginning of Period | 45,651 |
| | 73,727 |
| | 42,721 |
|
Cash and Cash Equivalents of Discontinued Operations, Beginning of Period | — |
| | 135 |
| | 63,223 |
|
Cash and Cash Equivalents, End of Period | $ | 140,140 |
| | $ | 45,651 |
| | $ | 73,862 |
|
| | | | | |
Cash and Cash Equivalents of Continuing Operations, End of Period | $ | 140,140 |
| | $ | 45,651 |
| | $ | 73,727 |
|
Cash and Cash Equivalents of Discontinued Operations, End of Period | $ | — |
| | $ | — |
| | $ | 135 |
|
| | | | | |
Supplemental Disclosure of Cash Flow Information | | | | | |
Cash paid during the period for interest expense | $ | 12,316 |
| | $ | 16,438 |
| | $ | 73,735 |
|
Cash paid during the period for income taxes | $ | 386 |
| | $ | 268 |
| | $ | 1,355 |
|
Supplemental Schedule of Non-Cash Investing and Financing Activities | | | | | |
Common stock dividends declared but not paid | $ | 8,019 |
| | $ | 7,999 |
| | $ | 7,971 |
|
Preferred stock dividends declared but not paid | $ | 930 |
| | $ | 930 |
| | $ | 930 |
|
Financing costs accrued but not paid | $ | 22 |
| | $ | — |
| | $ | — |
|
Additions to capital lease assets and liabilities | $ | 8,240 |
| | $ | 7,182 |
| | $ | 6,529 |
|
Option exercise | $ | 410 |
| | $ | 752 |
| | $ | 3,369 |
|
See notes to Consolidated Financial Statements.
DRIVE SHACK INC. AND SUBSIDIARIES
NOTES TO CONSOLIDATED FINANCIAL STATEMENTS
DECEMBER 31, 2016, 2015 and 2014
(dollars in tables in thousands, except per share data)
1. ORGANIZATION
Drive Shack Inc. (and with its subsidiaries, “Drive Shack Inc.” or the “Company”), is a leading owner and operator of golf-related leisure and entertainment businesses. On December 28, 2016, the Company changed its name from Newcastle Investment Corp. to Drive Shack Inc. in connection with its transformation to a leisure and entertainment company. The Company, a Maryland corporation, was formed in 2002, and its common stock is traded on the NYSE under the symbol “DS.”
Drive Shack Inc. conducts its business through the following segments: (i) Traditional Golf properties, (ii) Entertainment Golf venues, (iii) Debt Investments and (iv) corporate. For a further discussion of the reportable segments, see Note 4.
Drive Shack Inc.’s Traditional Golf business is one of the largest owners and operators of golf properties in the United States. As of December 31, 2016, the Company owned, leased or managed 78 properties across 13 states. Additionally, the Company plans to open a chain of next-generation Entertainment Golf venues across the United States and internationally which combine golf, competition, dining and fun. Drive Shack Inc. plans to monetize the remaining loans and securities in its Debt Investments segment as part of the transformation to a leisure and entertainment company.
On February 23, 2017, the Company revoked its election to be treated as a real estate investment trust (“REIT”), effective January 1, 2017. The Company operated in a manner intended to qualify as a REIT for federal income tax purposes through December 31, 2016. See Note 15 for additional information on our REIT status.
2. SUMMARY OF SIGNIFICANT ACCOUNTING POLICIES
GENERAL
Basis of Accounting — The accompanying Consolidated Financial Statements are prepared in accordance with U.S. generally accepted accounting principles (“GAAP’’). The Consolidated Financial Statements include the accounts of Drive Shack Inc. and its consolidated subsidiaries. All significant intercompany transactions and balances have been eliminated. The Company consolidates those entities in which it has an investment of 50% or more and has control over significant operating, financial and investing decisions of the entity as well as those entities deemed to be variable interest entities (“VIEs”) in which Drive Shack Inc. is determined to be the primary beneficiary.
For entities over which Drive Shack Inc. exercises significant influence, but which do not meet the requirements for consolidation, Drive Shack Inc. uses the equity method of accounting whereby it records its share of the underlying income of such entities.
Noncontrolling interest represents the equity interest in certain consolidated subsidiaries not owned by Drive Shack Inc. This is related to our Traditional Golf business, a portion of which Drive Shack Inc. does not own. In October 2016, Drive Shack Inc. exited certain golf properties in which the Company had a noncontrolling interest. The noncontrolling interest associated with the remaining golf property has a carrying value of zero. See Note 12 for additional information.
Prior Period Reclassifications — Certain prior period amounts have been reclassified to conform to the current period’s presentation. In connection with the Company’s continued transformation from a financial services company to a leisure and entertainment company, including the announcement of the new management team in September 2016, the revocation of its REIT election effective January 1, 2017, as well as the monetization and planned exit of our real estate related debt positions, the Company’s Consolidated Statements of Operations have been changed to reflect an operating company presentation. We have reclassified driving range revenue, including the monthly membership program offered at most of our public properties (“The Players Club’’) and miscellaneous revenue associated with operations from “Other revenue” to “Golf course operations”. We have reclassified expenses associated with the cost of merchandise sold from “Cost of sales - golf” to “Operating expenses.” We have added “Loan and security servicing expense” to “General and administrative expense.” The gains and losses associated with derivative instruments have been reclassified from “Other income (loss), net” to “Realized/unrealized (gain) loss on investments” to include balances as part of our operating income (loss). We have also reclassified other-than- temporary impairment related to our equity method investments from “Impairment” to “Other income” to align with our reporting of equity in earnings (losses) of equity method investees, net. The Company did not make changes to its Consolidated Balance Sheets given the carrying value of
DRIVE SHACK INC. AND SUBSIDIARIES
NOTES TO CONSOLIDATED FINANCIAL STATEMENTS
DECEMBER 31, 2016, 2015 and 2014
(dollars in tables in thousands, except per share data)
the real estate related investments, including agency FNMA/FHLMC securities, held by the Company still represents a significant amount on the Company's Consolidated Balance Sheets at December 31, 2016.
Risks and Uncertainties — We plan to develop and construct our Entertainment Golf business through long term land leases, land acquisition and redevelopment of existing golf courses. Developing new entertainment golf venues requires a significant amount of time and resources and poses a number of risks. Construction of new venues may result in cost overruns, delays or unanticipated expenses related to zoning or tax laws. We face competition for potential venue locations. Desirable venues may be unavailable or expensive, and the markets in which new venues are located may deteriorate over time. Additionally, the market potential of venues cannot be precisely determined, and our venues may face competition in new markets from unexpected sources. Constructed venues may not perform up to our expectations. For additional information, see Part I, Item 1A. “Risk Factors - Risk Related to Our Business.”
Use of Estimates — The preparation of financial statements in conformity with GAAP requires management to make estimates and assumptions that affect the reported amounts of assets and liabilities, the disclosure of contingent assets and liabilities at the date of the financial statements and the reported amounts of revenue and expenses during the reporting period. Actual results could differ from those estimates.
Comprehensive Income — Comprehensive income is defined as the change in equity of a business enterprise during a period from transactions and other events and circumstances, excluding those resulting from investments by and distributions to owners. For Drive Shack Inc.’s purposes, comprehensive income represents primarily net income, as presented in the Consolidated Statements of Operations, adjusted for unrealized gains or losses on securities available for sale for which we do not have the intent to sell and derivatives designated as cash flow hedges. Unrealized losses on securities with the intent to sell have been reclassified from other comprehensive income into income on the Consolidated Statements of Operations.
The following table summarizes Drive Shack Inc.’s accumulated other comprehensive income:
|
| | | | | | | |
| December 31, |
| 2016 | | 2015 |
Net unrealized gain on securities | $ | 1,168 |
| | $ | 33,277 |
|
Net unrealized gain (loss) on derivatives designated as cash flow hedges | — |
| | 20 |
|
Accumulated other comprehensive income | $ | 1,168 |
| | $ | 33,297 |
|
REVENUE RECOGNITION
Golf Course Operations — Revenue from green fees, cart rentals, merchandise sales and other operating activities (consisting primarily of range income, banquets, and club amenities) are generally recognized at the time of sale, when services are rendered and collection is reasonably assured.
Revenue from membership dues is recognized in the month earned. Membership dues received in advance are included in deferred revenues and recognized as revenue ratably over the appropriate period, which is generally twelve months or less. The membership dues are generally structured to cover the club operating costs and membership services.
Private country club members generally pay an advance initiation fee deposit upon their acceptance as a member to the respective country club. Initiation fee deposits are refundable 30 years after the date of acceptance as a member. The difference between the initiation fee deposit paid by the member and the present value of the refund obligation is deferred and recognized into revenue in the Consolidated Statements of Operations on a straight-line basis over the expected life of an active membership, which is estimated to be seven years. The present value of the refund obligation is recorded as a membership deposit liability in the Consolidated Balance Sheets and accretes over a 30-year nonrefundable term using the effective interest method. This accretion is recorded as interest expense in the Consolidated Statements of Operations.
Real Estate Securities and Loans Receivable — Drive Shack Inc. invests in securities, including real estate related asset backed securities and FNMA/FHLMC securities. Income on these securities is recognized using a level yield methodology based upon a number of cash flow assumptions that are subject to uncertainties and contingencies. For securities that are not acquired at a discount for credit quality, these assumptions include the rate and timing of principal and interest receipts (which may be subject
DRIVE SHACK INC. AND SUBSIDIARIES
NOTES TO CONSOLIDATED FINANCIAL STATEMENTS
DECEMBER 31, 2016, 2015 and 2014
(dollars in tables in thousands, except per share data)
to prepayments and defaults). For securities acquired at a discount for credit quality and with respect to which management has determined at acquisition that it is probable that all contractually required principal and interest payments will not be collected, these assumptions also include expected losses. For these securities, Drive Shack Inc. recognizes the excess of all expected cash flows over the investment in the securities, referred to as accretable yield, as interest income on a loss-adjusted yield basis. The loss adjusted yield is determined based on an evaluation of the credit status of securities, as described in connection with the analysis of impairment. The excess of total contractual cash flows over the cash flows expected to be collected is referred to as the nonaccretable difference and is not recognized as income. The assumptions that impact income recognition are updated on at least a quarterly basis if applicable to reflect changes related to a particular security, actual historical data, and market changes. These uncertainties and contingencies are difficult to predict and are subject to future events, and economic and market conditions, which may alter the assumptions. Drive Shack Inc. no longer invests in commercial mortgage backed securities but still invests in residential mortgage backed securities as of December 31, 2016.
Drive Shack Inc. also invests in loans, including real estate related loans, residential mortgage loans and subprime mortgage loans. The Company determines at acquisition whether loans will be aggregated into pools based on common risk characteristics (credit quality, loan type, and date of origination or acquisition); loans aggregated into pools are accounted for as if each pool were a single loan. The loans are evaluated at acquisition for evidence of credit quality deterioration. Interest income on performing loans is accrued and recognized as interest income at the contractual rate of interest. Loans for which it is determined that it is probable that all contractually required principal and interest payments at acquisition will not be collected are categorized as loans acquired at a discount for credit quality. Loans receivable are presented in the Consolidated Balance Sheets net of any unamortized discount (or gross of any unamortized premium) and an allowance for loan losses. Discounts or premiums are accreted into interest income on an effective yield or “interest” method, based upon a comparison of actual and expected cash flows, through the expected maturity date of the security or loan. Depending on the nature of the investment, changes to expected cash flows may result in a prospective change to yield or a retrospective change which would include a catch up adjustment. For loans acquired at a discount for credit quality, the difference between contractual cash flows and expected cash flows at acquisition is not accreted (non-accretable difference) and is not recognized as income. Probable increases in expected cash flows would first reverse any previously recorded allowance for loan losses with any remaining increases recognized prospectively as a yield adjustment over the remaining expected life of the loan. Drive Shack Inc. discontinues the accretion of discounts and amortization of premium on loans if they are reclassified from held-for-investment to held-for-sale. Interest income with respect to non-discounted securities or loans is recognized on an accrual basis. Deferred fees and costs, if any, are recognized as a reduction to the interest income over the terms of the securities or loans using the interest method. Upon settlement of securities and loans, the excess (or deficiency) of net proceeds over the net carrying value of such security or loan is recognized as a gain (or loss) in the period of settlement.
Impairment of Securities and Loans — Drive Shack Inc. continually evaluates securities and loans for impairment. Securities and loans are considered to be other-than-temporarily impaired, for financial reporting purposes, generally when it is probable that Drive Shack Inc. will be unable to collect all principal or interest when due according to the contractual terms of the original agreements, or, for securities or loans purchased at a discount for credit quality, whenever there has been a probable adverse change in the timing or amounts of expected cash flows, or that represent retained beneficial interests in securitizations, when Drive Shack Inc. determines that it is probable that it will be unable to collect as anticipated. The evaluation of a security’s estimated cash flows includes the following, as applicable: (i) review of the credit of the issuer or the borrower, (ii) review of the credit rating of the security, (iii) review of the key terms of the security or loan, (iv) review of the performance of the loan or underlying loans, including debt service coverage and loan to value ratios, (v) analysis of the value of the collateral for the loan or underlying loans, (vi) analysis of the effect of local, industry and broader economic factors, and (vii) analysis of historical and anticipated trends in defaults and loss severities for similar securities or loans. Furthermore, the Company must have the intent and ability to hold loans whose fair value is below carrying value until such fair value recovers, or until maturity, or else a write-down to fair value must be recorded. Similarly for securities, the Company must record a write-down if it has the intent to sell a given security in an unrealized loss position, or if it is more likely than not that it will be required to sell such a security. For certain securities which represent beneficial interests in securitized financial assets and non-Agency RMBS acquired with evidence of deteriorated credit quality for which it was deemed probable, at acquisition, that we would be unable to collect all contractually required payments as they come due, an other-than-temporary impairment also will be deemed to have occurred whenever there is a probable adverse change in the timing or amounts of previously projected estimated cash flows. Upon determination of impairment, Drive Shack Inc. establishes specific valuation allowances for loans or records a direct write-down for securities based on the estimated fair value of the security or underlying collateral using a discounted cash flow analysis or based on an observable market value. It is the Company’s policy to establish an allowance for uncollectible interest on performing securities or loans that are past due more than 90 days or sooner when, in the judgment of management, the probability of collection of interest is deemed to be insufficient to warrant further accrual. Upon such a determination, those loans are deemed to be non-performing and put on nonaccrual status.
DRIVE SHACK INC. AND SUBSIDIARIES
NOTES TO CONSOLIDATED FINANCIAL STATEMENTS
DECEMBER 31, 2016, 2015 and 2014
(dollars in tables in thousands, except per share data)
Actual losses may differ from the Company’s estimates. Drive Shack Inc. may resume accrual of income on a security or loan if, in management’s opinion, full collection is probable. Subsequent to a determination of impairment on securities, and a related write-down, income is accrued on an effective yield method from the new carrying value to the related expected cash flows, with cash received treated as a reduction of basis. Additionally, Drive Shack Inc. charges off the loan allowance when it determines the corresponding loans to be uncollectable.
Realized/Unrealized (Gain) Loss on Investments and Other Income (Loss), Net — These items are comprised of the following:
|
| | | | | | | | | | | |
| Year Ended December 31, |
| 2016 | | 2015 | | 2014 |
(Gain) on settlement of real estate securities | $ | (19,129 | ) | | $ | (42,356 | ) | | $ | (23,679 | ) |
Loss on settlement of real estate securities | 16,178 |
| | 9,850 |
| | — |
|
Unrealized loss on securities, intent-to-sell | 23,128 |
| | — |
| | — |
|
Realized (gain) loss on settlement of TBAs, net | (18,318 | ) | | 12,907 |
| | 4,151 |
|
(Gain) loss on repayment/disposition of loans held-for-sale | 48 |
| | (1,519 | ) | | (32,500 | ) |
Loss recognized on termination of derivative instruments | — |
| | 612 |
| | — |
|
Unrealized (gain) on non-hedge derivative instruments | (1,222 | ) | | (1,758 | ) | | (17,599 | ) |
Realized loss recognized upon de-designation of hedges | — |
| | — |
| | 34 |
|
Realized/unrealized (gain) loss on investments | $ | 685 |
| | $ | (22,264 | ) | | $ | (69,593 | ) |
| | | | | |
Gain (loss) on lease modifications and terminations | $ | (62 | ) | | $ | 471 |
| | $ | 7,219 |
|
Collateral management fee income, net | 592 |
| | 708 |
| | 963 |
|
Equity in earnings (losses) of equity method investees, net | (1,338 | ) | | (6,194 | ) | | 954 |
|
(Loss) on disposal of long-lived assets | (22 | ) | | (1,403 | ) | | (1,294 | ) |
Other income (loss) | (2,244 | ) | | 844 |
| | 437 |
|
Other income (loss), net | $ | (3,074 | ) | | $ | (5,574 | ) | | $ | 8,279 |
|
DRIVE SHACK INC. AND SUBSIDIARIES
NOTES TO CONSOLIDATED FINANCIAL STATEMENTS
DECEMBER 31, 2016, 2015 and 2014
(dollars in tables in thousands, except per share data)
Reclassification From Accumulated Other Comprehensive Income Into Net Income — The following table summarizes the amounts reclassified out of accumulated other comprehensive income into net income:
|
| | | | | | | | | | | | | | |
| | | | Year Ended December 31, |
Accumulated Other Comprehensive
Income (“AOCI”) Components | | Income Statement
Location | | 2016 | | 2015 | | 2014 |
Net realized (gain) loss on securities | | | | | | | | |
Impairment (reversal) | | Impairment (reversal) | | $ | 54 |
| | $ | (31 | ) | | $ | — |
|
(Gain) on settlement of real estate securities | | Realized/unrealized (gain) loss on investments | | (19,129 | ) | | (42,356 | ) | | (23,679 | ) |
Loss on settlement of real estate securities | | Realized/unrealized (gain) loss on investments | | 16,178 |
| | 9,850 |
| | — |
|
Realized (gain) on deconsolidation of CDO VI | | Gain on deconsolidation | | (20,682 | ) | | — |
| | — |
|
Unrealized loss on real estate securities, intent-to-sell, reclassified from AOCI into income | | Realized/unrealized (gain) loss on investments | | 23,128 |
| | — |
| | — |
|
| | | | $ | (451 | ) | | $ | (32,537 | ) | | $ | (23,679 | ) |
| | | | | | | | |
Net realized (gain) loss on derivatives designated as cash flow hedges | | | | | | | | |
Realized loss recognized upon de-designation of hedges | | Realized/unrealized (gain) loss on investments | | $ | — |
| | $ | — |
| | $ | 34 |
|
Loss recognized on termination of derivative instruments | | Realized/unrealized (gain) loss on investments | | — |
| | 612 |
| | — |
|
Amortization of deferred hedge (gain) | | Interest expense | | (20 | ) | | (78 | ) | | (61 | ) |
Loss reclassified from AOCI into income, related to effective portion | | Interest expense | | — |
| | 1,363 |
| | 4,379 |
|
| | | | $ | (20 | ) | | $ | 1,897 |
| | $ | 4,352 |
|
| | | | | | | | |
Total reclassifications | | | | $ | (471 | ) | | $ | (30,640 | ) | | $ | (19,327 | ) |
| | | | | | | | |
EXPENSE RECOGNITION
Operating Expenses — Operating expenses for Traditional Golf consist primarily of payroll, equipment and cart leases, utilities, repairs and maintenance, supplies, seed, soil and fertilizer, marketing and operating lease rent expense. Many of the Traditional Golf properties and related facilities are leased under long-term operating leases. In addition to minimum payments, certain leases require payment of the excess of various percentages of gross revenue or net operating income over the minimum rental payments. The leases generally require the payment of taxes assessed against the leased property and the cost of insurance and maintenance. The majority of lease terms range from 10 to 20 years, and typically, the leases contain renewal options. Certain leases include scheduled increases or decreases in minimum rental payments at various times during the term of the lease. These scheduled rent increases or decreases are recognized on a straight-line basis over the term of the lease. Increases result in an accrual, which is
DRIVE SHACK INC. AND SUBSIDIARIES
NOTES TO CONSOLIDATED FINANCIAL STATEMENTS
DECEMBER 31, 2016, 2015 and 2014
(dollars in tables in thousands, except per share data)
included in accounts payable, accrued expenses and other liabilities, and decreases result in a receivable, which is included in receivables and other assets, for the amount by which the cumulative straight-line rent differs from the contractual cash rent.
Deferred Costs — Deferred costs consist primarily of costs incurred in obtaining financing which are amortized into interest expense over the term of such financing using either the straight-line basis or the interest method. Deferred financing costs are presented as a direct deduction from the carrying amount of the related debt liability.
Interest Expense — Drive Shack Inc. finances its Debt Investments and Traditional Golf using both fixed and floating rate debt, including securitizations, mortgage loans, repurchase agreements, and other financing vehicles. Certain of this debt has been issued at a discount. Discounts are accreted into interest expense on the effective yield or interest method, based upon a comparison of actual and expected cash flows, through the expected maturity date of the financing. See Note 11 for additional information.
Derivatives and Hedging Activities — All derivatives are recognized as either assets or liabilities on the balance sheet and measured
at fair value. Drive Shack Inc. reports the fair value of derivative instruments gross of cash paid or received pursuant to credit support agreements and fair value is reflected on a net counterparty basis when Drive Shack Inc. believes a legal right of offset exists under an enforceable netting agreement. Fair value adjustments affect either equity or net income depending on whether the derivative instrument qualifies as a hedge for accounting purposes and, if so, the nature of the hedging activity. For those derivative instruments that are designated and qualify as hedging instruments, Drive Shack Inc. designates the hedging instrument, based upon the exposure being hedged, as a cash flow hedge or a fair value hedge.
Derivative transactions are entered into by Drive Shack Inc. solely for risk management purposes in the ordinary course of business. In determining whether to hedge a risk, Drive Shack Inc. may consider whether other assets, liabilities, firm commitments and anticipated transactions already offset or reduce the risk. All transactions undertaken as hedges are entered into with a view towards minimizing the potential for economic losses that could be incurred by Drive Shack Inc. As of December 31, 2016, the Company has no derivative instruments that qualify and are designated as hedging instruments, but has one interest rate cap with a fair value of $0.5 million which is not designated as a hedge.
Drive Shack Inc. transacts in the To Be Announced mortgage backed securities (“TBA”) market. TBA contracts are forward contracts to purchase mortgage-backed securities that will be issued by a U.S. government sponsored enterprise in the future. Drive Shack Inc. primarily engages in TBA transactions for purposes of managing interest rate risk and market risk associated with our Agency residential mortgage backed securities (“RMBS”) investments for which we have exposure to interest rate and market risk volatility.
Drive Shack Inc. typically does not take delivery of TBAs, but rather settles the associated receivable and payable with its trading counterparties on a net basis. As part of its TBA activities, Drive Shack Inc. may “roll” its TBA positions, whereby it may sell (buy) securities for delivery (receipt) in an earlier month and simultaneously contract to repurchase (sell) similar securities at an agreed-upon price on a fixed date in a later month. Drive Shack Inc. accounts for its TBA transactions as non-hedge instruments, with changes in market value recorded in the Statement of Operations. As of December 31, 2016, the Company held 3 short TBA contracts totaling $619.5 million in notional amount of Agency RMBS. As of December 31, 2016 and 2015, The Company funded approximately zero and $1.0 million, respectively, for margin calls related to TBA contracts.
Drive Shack Inc.’s derivative financial instruments contain credit risk to the extent that its bank counterparties may be unable to meet the terms of the agreements. Drive Shack Inc. seeks to reduce such risk by limiting its counterparties to major financial institutions. In addition, the potential risk of loss with any one party resulting from this type of credit risk is monitored. Management does not expect any material losses as a result of default by other parties.
Management Fees to Affiliate — These represent amounts due to the Manager pursuant to the Management Agreement. For further information on the Management Agreement, see Note 13.
BALANCE SHEET MEASUREMENT
Investments in Real Estate, Net — Real estate and related improvements are recorded at cost less accumulated depreciation. Costs that both materially add value to an asset and extend the useful life of an asset by more than a year are capitalized. With respect to golf course improvements (included in buildings and improvements), costs associated with original construction, significant replacements, permanent landscaping, sand traps, fairways, tee boxes or greens are capitalized. All other asset-related costs that do not meet these criteria, such as minor repairs and routine maintenance, are expensed as incurred.
DRIVE SHACK INC. AND SUBSIDIARIES
NOTES TO CONSOLIDATED FINANCIAL STATEMENTS
DECEMBER 31, 2016, 2015 and 2014
(dollars in tables in thousands, except per share data)
Long-lived assets to be disposed of by sale, which meet certain criteria, are reclassified to real estate held-for-sale and measured at the lower of their carrying amount or fair value less costs of sale. A disposal of a component of an entity or a group of components of an entity are reported in discontinued operations if the disposal represents a strategic shift that has or will have a major effect on Drive Shack Inc.’s operations and financial results. Discontinued operations are retroactively reclassified to income (loss) from discontinued operations for all periods presented.
Traditional Golf leases certain golf carts and other equipment that are classified as capital leases. The value of capital leases is recorded as an asset on the balance sheet, along with a liability related to the associated payments. Depreciation of capital lease assets is calculated using the straight-line method over the shorter of the estimated useful lives and the expected lease terms. The cost of equipment under capital leases is included in investments in real estate in the Consolidated Balance Sheets. Payments under the leases are treated as reductions of the liability, with a portion being recorded as interest expense under the effective interest method.
Depreciation is calculated using the straight-line method based on the following estimated useful lives:
|
| |
Buildings and improvements | 10-30 years |
Capital leases - equipment | 3-7 years |
Furniture, fixtures, and equipment | 3-7 years |
Intangibles — Intangible assets and liabilities relating to Traditional Golf consist primarily of leasehold advantages (disadvantages), management contracts and membership base. A leasehold advantage (disadvantage) exists to Drive Shack Inc. when it pays a contracted rent that is below (above) market rents at the date of the transaction. The value of a leasehold advantage (disadvantage) is calculated based on the differential between market and contracted rent, which is tax effected and discounted to present value based on an after-tax discount rate corresponding to each golf property, and is amortized over the term of the underlying lease agreement. The management contract intangible represents Drive Shack Inc.’s golf course management contracts for both leased and managed properties. The management contract intangible for leased and managed properties is valued utilizing a discounted cash flow methodology under the income approach and is amortized over the term of the underlying lease or management agreements, respectively. The membership base intangible represents Drive Shack Inc.’s relationship with its private country club members. The membership base intangible is valued using the multi-period excess earnings method under the income approach, and is amortized over the expected life of an active membership.
Amortization of leasehold intangible assets and liabilities is included within operating expenses and amortization of all other intangible assets is included within depreciation and amortization in the Consolidated Statements of Operations. Amortization of all intangible assets is calculated using the straight-line method based on the following estimated useful lives:
|
| |
Trade name | 30 years |
Leasehold intangibles | 1 - 26 years |
Management contracts | 1 - 26 years |
Internally-developed software | 5 years |
Membership base | 7 years |
Impairment of Real Estate and Finite-lived Intangible Assets — Drive Shack Inc. periodically reviews the carrying amounts of its long-lived assets, including real estate and finite-lived intangible assets, to determine whether current events or circumstances indicate that such carrying amounts may not be recoverable. The assessment of recoverability is based on management’s estimates by comparing the sum of the estimated undiscounted cash flows generated by the underlying asset, or other appropriate grouping of assets, to its carrying value to determine whether an impairment existed at its lowest level of identifiable cash flows. If the carrying amount of the asset is greater than the expected undiscounted cash flows to be generated by such asset, an impairment is recognized to the extent the carrying value of such asset exceeds its fair value. Drive Shack Inc. generally measures fair value by considering sale prices for similar assets or by discounting estimated future cash flows using an appropriate discount rate. Assets to be disposed of are carried at the lower of their financial statement carrying amount or fair value less costs to sell.
DRIVE SHACK INC. AND SUBSIDIARIES
NOTES TO CONSOLIDATED FINANCIAL STATEMENTS
DECEMBER 31, 2016, 2015 and 2014
(dollars in tables in thousands, except per share data)
Membership Deposit Liabilities — Private country club members generally pay an advance initiation fee deposit upon their acceptance as a member to the respective country club. Initiation fee deposits are refundable 30 years after the date of acceptance as a member. The difference between the initiation fee deposit paid by the member and the present value of the refund obligation is deferred and recognized into golf course operations revenue in the Consolidated Statements of Operations on a straight-line basis over the expected life of an active membership, which is estimated to be seven years. The present value of the refund obligation is recorded as a membership deposit liability in the Consolidated Balance Sheets and accretes over a 30-year nonrefundable term using the effective interest method. This accretion is recorded as interest expense in the Consolidated Statements of Operations.
Investment in Real Estate Securities — Drive Shack Inc. has classified its investments in securities as available-for-sale. Securities available-for-sale are carried at market value with the net unrealized gains or losses reported as a separate component of accumulated other comprehensive income, to the extent impairment losses are considered temporary. At disposition, the net realized gain or loss is determined on the basis of the cost of the specific investments and is included in earnings. Unrealized losses on securities are charged to earnings if there is an intent to sell or if they reflect a decline in value that is other-than-temporary, as described above.
Loans Held-for-Sale — Loans held-for-sale are recorded net of any unamortized discount (or gross of any unamortized premiums), including any fees received and are measured at the lower of cost or fair value. Purchase price discounts or premiums are deferred in a contra loan account until the related loans is sold. The deferred discounts or premiums are an adjustment to the basis of the loan and are included in the quarterly determination of the lower of cost or fair value adjustments and/or the gain or loss recognized at the time of sale.
Other Investment — Drive Shack Inc. owns a 23% economic interest in a limited liability company which owns preferred equity secured by a commercial real estate project. Drive Shack Inc. accounts for this investment as an equity method investment. As of December 31, 2016 and 2015, the carrying value of this investment was $19.3 million and $20.6 million, respectively. Drive Shack Inc. evaluates its equity method investment for other than temporary impairment whenever events or changes in circumstances indicate that the carrying amount of the investment might not be recoverable. The evaluation of recoverability is based on management’s assessment of the financial condition and near term prospects of the commercial real estate project, the length of time and the extent to which the market value of the investment has been less than cost, availability and cost of financing, demand for space, competition for tenants, changes in market rental rates, and operating costs. As these factors are difficult to predict and are subject to future events that may alter management’s assumptions, the values estimated by management in its recoverability analyses may not be realized, and actual losses or impairment may be realized in the future. Based on changes in estimates of project costs and timeline, the Company recorded an other than temporary impairment of $2.9 million and $7.5 million during the years ended December 31, 2016 and 2015, respectively. The other than temporary impairment is recorded in the equity in earnings (loss) in equity method investees, net line item which is reported in the Consolidated Statements of Operations in “Other income (loss).” There was zero impairment recorded during the year ended December 31, 2014. As the fair value inputs utilized are unobservable, the Company determined that the significant inputs used to value this real estate investment falls within Level 3 for fair value reporting.
Investments in CDO Servicing Rights — In February 2011, Drive Shack Inc., through one of its subsidiaries, purchased the management rights with respect to certain C-BASS Investment Management LLC (“C-BASS”) CDOs for $2.2 million pursuant to a bankruptcy proceeding. Drive Shack Inc. initially recorded the cost of acquiring the collateral management rights as a servicing asset and subsequently amortizes this asset in proportion to, and over the period of, estimated net servicing income. Servicing assets are assessed for impairment on a quarterly basis, with impairment recognized as a valuation allowance. Key economic assumptions used in measuring any potential impairment of the servicing assets include the prepayment speeds of the underlying collateral, default rates, loss severities and discount rates. During the years ended December 31, 2016, 2015 and 2014, Drive Shack Inc. recorded $0.3 million, $0.3 million, and $0.3 million, respectively, of servicing rights amortization and no servicing rights impairment. As of December 31, 2016 and 2015, Drive Shack Inc.’s servicing asset had a carrying value of $0.4 million and $0.7 million, respectively, recorded in receivables and other assets.
Variable Interest Entities (“VIEs”) — VIEs are defined as entities in which equity investors do not have the characteristics of a controlling financial interest or do not have sufficient equity at risk for the entity to finance its activities without additional subordinated financial support from other parties. A VIE is required to be consolidated only by its primary beneficiary, which is defined as the party who has the power to direct the activities of a VIE that most significantly impact its economic performance and who has the obligation to absorb losses or the right to receive benefits from the VIE that could potentially be significant to the VIE.
DRIVE SHACK INC. AND SUBSIDIARIES
NOTES TO CONSOLIDATED FINANCIAL STATEMENTS
DECEMBER 31, 2016, 2015 and 2014
(dollars in tables in thousands, except per share data)
Drive Shack Inc.’s subprime securitizations (see Note 6), CDO V, and CDO VI are considered VIEs, but Drive Shack Inc. does not control the decisions that most significantly impact their economic performance and no longer receives a significant portion of their returns.
Drive Shack Inc. deconsolidated CDO V as of June 17, 2011 as a result of an event of default which allowed Drive Shack Inc. to be removed as collateral manager and prevents purchasing and selling of certain collateral within CDO V. In August 2016, Drive Shack Inc. settled on a trade to sell $14.8 million face amount of two CDO V securities for total proceeds of $9.9 million (see Note 5). As a result of this trade, Drive Shack Inc. no longer has a variable or economic interest in CDO V. Drive Shack Inc. continues to receive servicing fees as collateral manager, which are not considered variable interests in CDO V.
In March 2016, Drive Shack Inc. sold to third parties $11.0 million face amount of NCT 2013-VI Class I-MM-2 at a price of 93.0% of par. This tranche was previously held by Drive Shack Inc. since issuance and was eliminated in consolidation. By selling this tranche, Drive Shack Inc. was no longer deemed the primary beneficiary of CDO VI. As a result of this sale, Drive Shack Inc. deconsolidated CDO VI from its Consolidated Balance Sheet, which included $43.9 million carrying value of real estate securities available-for-sale, $93.1 million of CDO bonds payable, and $12.4 million of other bonds payable. In addition, Drive Shack Inc. reclassified $20.7 million of related other comprehensive income into earnings, and recognized a total gain of approximately $82.1 million as a result of deconsolidating CDO VI. As a result of this transaction, Drive Shack Inc. no longer has a variable interest in CDO VI. Drive Shack Inc. continues to receive servicing fees as collateral manager, which are not considered variable interests in CDO VI.
The following table presents certain assets of consolidated VIEs which are included in the Consolidated Balance Sheets and there were no such assets as of December 31, 2016. The assets in the table below include only those assets that can be used to settle obligations of consolidated VIEs, and are equal to or in excess of those obligations. Additionally, the assets in the table below exclude intercompany balances that eliminate in consolidation.
|
| | | | |
| | December 31, 2015 |
Assets of consolidated VIEs that can only be used to settle obligations of consolidated VIEs | | |
Real estate securities, available-for-sale | | $ | 46,392 |
|
Subprime mortgage loans subject to call option | | 380,806 |
|
Restricted cash | | 128 |
|
Receivables and other assets | | 77 |
|
Total assets of consolidated VIEs that can only be used to settle obligations of consolidated VIEs | | $ | 427,403 |
|
The following table presents certain liabilities of consolidated VIEs which are included in the Consolidated Balance Sheets and there were no such liabilities as of December 31, 2016. The liabilities in the table below include third-party liabilities of consolidated VIEs due to third parties only, and exclude intercompany balances that eliminate in consolidation. The liabilities also exclude amounts where creditors or beneficial interest holders have recourse to the general credit of Drive Shack Inc.
|
| | | | |
| | December 31, 2015 |
Liabilities of consolidated VIEs for which creditors or beneficial interest holders do not have recourse to the general credit of Drive Shack Inc. | | |
CDO bonds payable | | $ | 92,933 |
|
Other bonds and notes payable | | 4,672 |
|
Financing of subprime mortgage loans subject to call option | | 380,806 |
|
Accounts payable, accrued expenses and other liabilities | | 29 |
|
Total liabilities of consolidated VIEs for which creditors or beneficial interest holders do not have recourse to the general credit of Drive Shack Inc. | | $ | 478,440 |
|
Repurchase Agreements — Securities sold under repurchase agreements are treated as collateralized financing transactions. Securities financed through a repurchase agreement remain on the Consolidated Balance Sheets as an asset and cash received from
DRIVE SHACK INC. AND SUBSIDIARIES
NOTES TO CONSOLIDATED FINANCIAL STATEMENTS
DECEMBER 31, 2016, 2015 and 2014
(dollars in tables in thousands, except per share data)
the purchaser is recorded on the Consolidated Balance Sheets as a liability. Interest paid in accordance with repurchase agreements is recorded as interest expense in the Consolidated Statements of Operations.
Acquisition Accounting — Drive Shack Inc. has determined that all of its acquisitions should be accounted for under the acquisition method. The accounting for acquisitions requires the identification and measurement of all acquired tangible and intangible assets and assumed liabilities at their respective fair values, as of the respective transaction dates. The determination of the fair value of net assets acquired involves significant judgment and estimates, such as Drive Shack Inc.'s estimates of future cash flows based on a number of factors including known and anticipated trends, as well as market and economic conditions.
In measuring the fair value of tangible and identified intangible assets acquired and liabilities assumed, management uses information obtained as a result of pre-acquisition due diligence, marketing, leasing activities and independent appraisals. In the case of buildings, the fair value of the tangible assets acquired is determined by valuing the property as if it were vacant. Significant estimates impacting the measurement at fair value of real property includes qualitative selection of comparable market transactions as well as the assessment of the relative quality and condition of the acquired properties.
Cash and Cash Equivalents and Restricted Cash — Drive Shack Inc. considers all highly liquid short-term investments with maturities of 90 days or less when purchased to be cash equivalents. Substantially all amounts on deposit with major financial institutions exceed insured limits. Restricted cash consisted of:
|
| | | | | | | |
| December 31, |
| 2016 | | 2015 |
CDO bond sinking funds | $ | — |
| | $ | 51 |
|
CDO trustee accounts | 192 |
| | 272 |
|
Derivative margin accounts | — |
| | 887 |
|
Restricted cash for construction-in-progress | 2,267 |
| | 2,784 |
|
Other restricted cash - traditional golf | 3,945 |
| | 475 |
|
| $ | 6,404 |
| | $ | 4,469 |
|
DRIVE SHACK INC. AND SUBSIDIARIES
NOTES TO CONSOLIDATED FINANCIAL STATEMENTS
DECEMBER 31, 2016, 2015 and 2014
(dollars in tables in thousands, except per share data)
Reduction of assets and liabilities relating to spin-offs and acquisitions that are non-cash are disclosed below (there were no such reductions for the years ended December 31, 2016 and 2015): |
| | | | |
| | Year Ended December 31, 2014 |
Reduction of Assets and Liabilities relating to the spin-off of New Media and New Senior, non-cash portion | | |
Investments in senior housing real estate, net | | $ | 1,574,048 |
|
Property, plant and equipment, net | | $ | 266,385 |
|
Goodwill and intangibles, net | | $ | 379,008 |
|
Restricted cash | | $ | 6,477 |
|
Receivables and other assets | | $ | 197,882 |
|
Mortgage notes payable | | $ | 1,260,633 |
|
Credit facilities - media | | $ | 177,955 |
|
Accrued expenses and other liabilities | | $ | 189,940 |
|
Supplemental non-cash investing and financing activities relating to CDOs are disclosed below:
|
| | | | | | | | | | | |
| Year Ended December 31, |
| 2016 | | 2015 | | 2014 |
Restricted cash generated from sale of securities | $ | — |
| | $ | 139,257 |
| | $ | 125,850 |
|
Restricted cash generated from sale of loans | $ | — |
| | $ | 55,574 |
| | $ | — |
|
Restricted cash generated from pay downs on securities and loans | $ | 2,310 |
| | $ | 78,853 |
| | $ | 325,932 |
|
Restricted cash used for repayments of CDO and other bonds payable | $ | 2,748 |
| | $ | 148,966 |
| | $ | 382,177 |
|
CDO VI deconsolidation: | | | | | |
Real estate securities | $ | 43,889 |
| | $ | — |
| | $ | — |
|
Restricted cash | $ | 67 |
| | $ | — |
| | $ | — |
|
CDO and other bonds payable | $ | 105,423 |
| | $ | — |
| | $ | — |
|
Receivables and Other Assets
Receivables and other assets are comprised of the following, net of allowances for doubtful accounts of $1.1 million and $1.0 million, as of December 31, 2016 and 2015:
|
| | | | | | | |
| December 31, |
| 2016 | | 2015 |
Accounts receivable, net | $ | 8,047 |
| | $ | 9,889 |
|
Prepaid expenses | 3,654 |
| | 3,205 |
|
Interest receivable | 1,697 |
| | 1,142 |
|
Deposits | 4,105 |
| | 7,437 |
|
Inventory | 4,496 |
| | 5,057 |
|
Derivative assets | 856 |
| | 127 |
|
Residential mortgage loans, held-for-sale, net | 231 |
| | 532 |
|
Miscellaneous assets, net (A) | 14,931 |
| | 11,157 |
|
| $ | 38,017 |
| | $ | 38,546 |
|
| |
(A) | Includes one owned property in Annandale, New Jersey in the Traditional Golf segment classified as held-for-sale as of December 31, 2016. The Company recorded an impairment of $3.6 million based on our estimated selling price. We expect to close on this property within the next 12 months. |
DRIVE SHACK INC. AND SUBSIDIARIES
NOTES TO CONSOLIDATED FINANCIAL STATEMENTS
DECEMBER 31, 2016, 2015 and 2014
(dollars in tables in thousands, except per share data)
Accounts Receivable, Net – Accounts receivable are stated at amounts due from customers, net of an allowance for doubtful accounts. The allowance for doubtful accounts is based upon several factors including the length of time the receivables are past due, historical payment trends and current economic factors. Collateral is generally not required. The allowance for doubtful accounts increased by $0.1 million and $0.09 million for the years ended December 31, 2016 and 2015, respectively.
Prepaid Expenses – Prepaid expenses consists primarily of prepaid insurance and prepaid rent and are expensed over the usage period of the goods or services.
Interest Receivable – Interest receivable consists primarily of interest earned on real estate securities.
Deposits – Deposits consist primarily of property lease security deposits for Traditional Golf.
Inventory – Inventory is valued at the lower of cost or market. Cost is determined on the first-in, first-out (“FIFO”) method. Inventories in Traditional Golf consist primarily of food, beverages and merchandise for sale.
Derivative Assets – All derivative assets on the balance sheet are measured at fair value.
Residential Mortgage Loans Held-for-Sale, net - Loans held-for-sale are marked to the lower of carrying value or fair value.
Accounts Payable, Accrued Expenses and Other Liabilities
Accounts payable, accrued expenses and other liabilities are comprised of the following:
|
| | | | | | | |
| December 31, |
| 2016 | | 2015 |
Accounts payable and accrued expenses | $ | 26,249 |
| | $ | 26,966 |
|
Deferred revenue | 36,107 |
| | 33,926 |
|
Security deposits payable | 6,073 |
| | 5,975 |
|
Unfavorable leasehold interests | 4,225 |
| | 5,485 |
|
Derivative liabilities | — |
| | 684 |
|
Accrued rent | 2,613 |
| | 3,135 |
|
Due to affiliates | 892 |
| | 892 |
|
Miscellaneous liabilities | 12,278 |
| | 11,876 |
|
| $ | 88,437 |
| | $ | 88,939 |
|
Accounts Payable and Accrued Expenses – Accounts payable reflect expenses related to goods and services received that have not yet been paid and accrued expenses reflect invoices that have not yet been received.
Deferred Revenue – Payments received in advance of the performance of services are recorded as deferred revenue until the services are performed.
Security Deposits Payable – Security deposits payable relate to deposits received for events at traditional golf properties.
Unfavorable Leasehold Interests – Unfavorable leasehold interests relates to leases acquired as part of Traditional Golf where the terms of the leasehold contracts are less favorable than the estimated market terms of the leases at the acquisition date.
Derivative Liabilities – All derivative liabilities on the balance sheet are measured at fair value.
Accrued Rent – Traditional golf properties pay rent on certain leased properties in arrears and scheduled rent increases are recognized on a straight-line basis over the term of the lease, resulting in an accrual.
Due to Affiliates – Represents amounts due to the Manager pursuant to the Management Agreement.
DRIVE SHACK INC. AND SUBSIDIARIES
NOTES TO CONSOLIDATED FINANCIAL STATEMENTS
DECEMBER 31, 2016, 2015 and 2014
(dollars in tables in thousands, except per share data)
Options — The fair value of the options issued as compensation to the Manager for its successful efforts in raising capital for Drive Shack Inc. was recorded as an increase in equity with an offsetting reduction of capital proceeds received. Options granted to Drive Shack Inc.’s directors were accounted for using the fair value method.
Preferred Stock — Drive Shack Inc.’s accounting policy for its preferred stock is described in Note 12.
Income Taxes – Drive Shack Inc. recognizes tax benefits for uncertain tax positions only if it is more likely than not that the position is sustainable based on its technical merits. Interest and penalties on uncertain tax positions are included as a component of the provision for income taxes in the Consolidated Statements of Operations.
On February 23, 2017, the Company revoked its election to be treated as a REIT effective January 1, 2017. The Company operated in a manner intended to qualify as a REIT for federal income tax purposes through December 31, 2016. The Company recognized in its financial statements the effects of its change in REIT status since the Company completed all significant actions necessary to revoke its election as of December 31, 2016. The change in tax status has had no effect on the Company’s Consolidated Financial Statements as the corresponding net deferred tax asset created as a result of the tax status change has been fully offset with a valuation allowance.
Amortization of Discount and Premium and Other Amortization — As reflected in the Consolidated Statements of Cash Flows, these items are comprised of the following:
|
| | | | | | | | | | | |
| Year Ended December 31, |
| 2016 | | 2015 | | 2014 |
Accretion of net discount on securities, loans and other investments | $ | (7,926 | ) | | $ | (5,802 | ) | | $ | (28,638 | ) |
Amortization of net discount on debt obligations and deferred financing costs | 1,501 |
| | 3,325 |
| | 14,217 |
|
Amortization of net deferred hedge gains – debt | (20 | ) | | (78 | ) | | (61 | ) |
Amortization of discount and premium | $ | (6,445 | ) | | $ | (2,555 | ) | | $ | (14,482 | ) |
| | | | | |
Amortization of leasehold intangibles | $ | 4,451 |
| | $ | 4,942 |
| | $ | 5,000 |
|
Accretion of membership deposit liability | 5,803 |
| | 5,840 |
| | 5,663 |
|
Other amortization | $ | 10,254 |
| | $ | 10,782 |
| | $ | 10,663 |
|
DRIVE SHACK INC. AND SUBSIDIARIES
NOTES TO CONSOLIDATED FINANCIAL STATEMENTS
DECEMBER 31, 2016, 2015 and 2014
(dollars in tables in thousands, except per share data)
Recent Accounting Pronouncements — In May 2014, the Financial Accounting Standards Board (“FASB”) issued Accounting Standards Update (“ASU”) 2014-09 Revenue from Contracts with Customers (Topic 606). The standard’s core principle is that a company will recognize revenue when it transfers promised goods or services to customers in an amount that reflects the consideration to which the company expects to be entitled in exchange for those goods or services. In doing so, companies will need to use more judgment and make more estimates than under today’s guidance. These may include identifying performance obligations in the contract, estimating the amount of variable consideration to include in the transaction price and allocating the transaction price to each separate performance obligation. In August 2015, the FASB issued ASU 2015-14 Revenue from Contracts with Customers (Topic 606): Deferral of the Effective Date, which defers the effective date by one year. The standard will be effective for annual and interim periods beginning after December 15, 2017; however, all entities are allowed to adopt the standard as early as the original effective date (annual periods beginning after December 15, 2016). Entities have the option of using either a full retrospective or a modified approach to adopt the guidance. In March 2016, the FASB issued ASU 2016-08 Revenue from Contracts with Customers (Topic 606): Principal versus Agent Considerations which clarifies how an entity should identify the unit of accounting for the principal versus agent evaluation and how to apply the control principle to certain types of arrangements. In April 2016, the FASB issued ASU 2016-10 Revenue from Contracts with Customers (Topic 606): Identifying Performance Obligations and Licensing, which clarifies when a promised good or service is separately identifiable. In May 2016, the FASB issued ASU 2016-12 Revenue from Contracts with Customers (Topic 606): Narrow-Scope Improvements and Practical Expedients which amends the new revenue recognition guidance on transition, collectability, noncash consideration and the presentation of sales and other similar taxes. In December 2016, the FASB issued ASU 2016-20 Technical Corrections and Improvements to Topic 606, Revenue from Contracts with Customers which amends the new revenue recognition guidance on performance obligations and 12 additional technical corrections and improvements. During 2016, the Company began evaluating potential impacts of adopting this standard, and is in the process of reviewing customer contracts and revenue streams, identifying contractual provisions that may result in a change in the timing or the amount of revenue recognized. The Company expects to adopt the requirements of the new standard in the first quarter of 2018, and anticipates using the modified retrospective transition method.
In February 2015, the FASB issued ASU 2015-02, Consolidation (Topic 810): Amendments to the Consolidation Analysis. The standard amends the consolidation considerations when evaluating certain limited partnerships, variable interest entities and investment funds. The Company adopted this guidance in the first quarter of 2016.
In January 2016, the FASB issued ASU 2016-01 Financial Instruments - Overall (Subtopic 825-10): Recognition and Measurement of Financial Assets and Financial Liabilities. The standard addresses certain aspects of recognition, measurement, presentation and disclosure of financial instruments. The effective date of the standard will be for fiscal years, and interim periods within those fiscal years, beginning after December 15, 2017. The Company is currently evaluating the new guidance to determine the impact it may have on its Consolidated Financial Statements.
In February 2016, the FASB issued ASU 2016-02 Leases (Topic 842). The standard requires lessees to recognize most leases on the balance sheet and addresses certain aspects of lessor accounting. The effective date of the standard will be for fiscal years, and interim periods within those fiscal years, beginning after December 15, 2018 and early adoption is permitted. Entities are required to use a modified retrospective approach for leases that exist or are entered into after the beginning of the earliest comparative period in the financial statements, with an option to use certain relief. The Company is currently evaluating the new guidance to determine the impact it may have on its Consolidated Financial Statements.
In June 2016, the FASB issued ASU 2016-13 Financial Instruments - Credit Losses (Topic 326), Measurement of Credit Losses on Financial Instruments. The standard changes how entities will measure credit losses for most financial assets and certain other instruments that are not measured at fair value through net income. For available-for-sale debt securities, entities will be required to record allowances rather than reduce the carrying amount under the other-than-temporary impairment model. The effective date of the standard will be for fiscal years, and interim periods within those fiscal years, beginning after December 15, 2019 and early adoption is permitted for annual periods beginning after December 15, 2018. Entities will apply the standard's provisions as a cumulative-effect adjustment to retained earnings as of the beginning of the first reporting period in which the guidance is effective. The Company is currently evaluating the new guidance to determine the impact it may have on its Consolidated Financial Statements.
In August 2016, the FASB issued ASU 2016-15 Statement of Cash Flows (Topic 230), Classification of Certain Cash Receipts and Cash Payments. The standard provides specific guidance over eight identified cash flow issues in order to reduce diversity in practice over the presentation and classification of certain types of cash receipts and cash payments. The effective date of the standard will be for fiscal years, and interim periods within those fiscal years, beginning after December 15, 2017 and early adoption
DRIVE SHACK INC. AND SUBSIDIARIES
NOTES TO CONSOLIDATED FINANCIAL STATEMENTS
DECEMBER 31, 2016, 2015 and 2014
(dollars in tables in thousands, except per share data)
is permitted. Entities should apply the standard using a retrospective transition method to each period presented. The Company is currently evaluating the new guidance to determine the impact it may have on its Consolidated Financial Statements.
In November 2016, the FASB issued ASU 2016-18 Statement of Cash Flows (Topic 230), Restricted Cash. The standard requires entities to show the changes in the total of cash, cash equivalents and restricted cash in the statement of cash flows and provide a reconciliation to the related line items in the balance sheet. The effective date of the standard will be for fiscal years, and interim periods within those fiscal years, beginning after December 15, 2017 and early adoption is permitted. Entities will be required to apply the guidance retrospectively when adopted and provide the relevant disclosures in ASC 250, in the first interim and annual periods in which the guidance is adopted. The Company is currently evaluating the new guidance to determine the impact it may have on its Consolidated Financial Statements.
The FASB has recently issued or discussed a number of proposed standards on such topics as financial statement presentation, financial instruments and hedging. Some of the proposed changes are significant and could have a material impact on the Company’s reporting. The Company has not yet fully evaluated the potential impact of these proposals, but will make such an evaluation as the standards are finalized.
3. DISCONTINUED OPERATIONS
On February 13, 2014, Drive Shack Inc. completed the spin-off of New Media Investment Group Inc. (“New Media”) from Drive Shack Inc.
On November 6, 2014, Drive Shack Inc. completed the spin-off of New Senior Investment Group Inc. (“New Senior”) from Drive Shack Inc.
In April 2015, Drive Shack Inc. closed the sale of its commercial real estate properties in Beavercreek, OH for $7.0 million, net of closing costs, and recognized a net gain on the sale of these assets of approximately $0.3 million. In addition, Drive Shack Inc. repaid the related debt on this property of $6.0 million held within CDO IX, which was eliminated in consolidation.
As a result of the spin-offs and the sale of the commercial real estate properties in Beavercreek, OH (which was initially reported as held-for-sale as of September 30, 2014), the assets, liabilities and results of operations of those components of Drive Shack Inc.’s operations that (i) were part of the spin-offs and/or (ii) represent operations Drive Shack Inc. plans to sell in which it has no significant continuing involvement, are presented separately in discontinued operations in the Company’s Consolidated Financial Statements for all periods presented.
There were no assets and liabilities of discontinued operations as of December 31, 2016 and 2015.
Results of operations from discontinued operations were as follows:
DRIVE SHACK INC. AND SUBSIDIARIES
NOTES TO CONSOLIDATED FINANCIAL STATEMENTS
DECEMBER 31, 2016, 2015 and 2014
(dollars in tables in thousands, except per share data)
|
| | | | | | | | | | | |
| Year Ended December 31, |
| 2016 | | 2015 | | 2014 |
Revenues | | | | | |
Media income | $ | — |
| | $ | — |
| | $ | 68,212 |
|
Rental income | — |
| | 556 |
| | 194,729 |
|
Care and ancillary income | — |
| | — |
| | 20,428 |
|
Total revenues | — |
| | 556 |
| | 283,369 |
|
| | | | | |
Operating Costs | | | | | |
Property operating expenses | — |
| | 187 |
| | 152,896 |
|
General and administrative expense (A) | — |
| | 30 |
| | 20,096 |
|
Depreciation and amortization | — |
| | 11 |
| | 90,627 |
|
Management fee to affiliate | — |
| | — |
| | 7,789 |
|
Gain on settlement of investments | — |
| | (318 | ) | | — |
|
Total operating costs | — |
| | (90 | ) | | 271,408 |
|
| | | | | |
Other Income (Expenses) | | | | | |
Interest expense | — |
| | — |
| | (49,705 | ) |
Other income | — |
| | — |
| | 1,444 |
|
Total other income (expenses) | — |
| | — |
| | (48,261 | ) |
Income tax (benefit) | — |
| | — |
| | (1,111 | ) |
Income (loss) from discontinued operations, net of tax | $ | — |
| | $ | 646 |
| | $ | (35,189 | ) |
| |
(A) | Includes acquisition and spin-off related expenses of $15.8 million for the year ended December 31, 2014. There were no acquisition and spin-off related expenses for the years ended December 31, 2016 and 2015. |
DRIVE SHACK INC. AND SUBSIDIARIES
NOTES TO CONSOLIDATED FINANCIAL STATEMENTS
DECEMBER 31, 2016, 2015 and 2014
(dollars in tables in thousands, except per share data)
4. SEGMENT REPORTING
At the end of September 2016, a new management team was put in place to drive the strategic priorities of the Company in its continued transformation from a financial services company to a leisure and entertainment company. The chief operating decision maker (“CODM”) is our Chief Executive Officer, and in the fourth quarter of 2016, Drive Shack Inc. changed its reportable segment disclosures to reflect the manner in which our CODM manages our businesses, including resource allocation and performance assessment.
The Company currently has four reportable segments: (i) Traditional Golf properties, (ii) Entertainment Golf venues, (iii) Debt Investments, and (iv) corporate. The CODM reviews discrete financial information for each reportable segment to manage the Company.
Drive Shack Inc.’s Traditional Golf business is one of the largest owners and operators of golf properties in the United States. As of December 31, 2016, Drive Shack Inc. owned, leased or managed 78 properties across 13 states. Additionally, Drive Shack Inc. plans to open a chain of next-generation Entertainment Golf venues across the United States and internationally which combine golf, competition, dining and fun.
Drive Shack Inc.’s Debt Investment segment consists primarily of loans and securities which the Company plans to monetize as part of its transformation to a leisure and entertainment company. The corporate segment consists primarily of interest income on short-term investments, general and administrative expenses, interest expense on the junior subordinated notes payable (Note 11) and management fees pursuant to the Management Agreement (Note 13).
DRIVE SHACK INC. AND SUBSIDIARIES
NOTES TO CONSOLIDATED FINANCIAL STATEMENTS
DECEMBER 31, 2016, 2015 and 2014
(dollars in tables in thousands, except per share data)
Summary financial data on Drive Shack Inc.’s segments is given below, together with reconciliation to the same data for Drive Shack Inc. as a whole:
|
| | | | | | | | | | | | | | | | | | | |
| Traditional Golf | | Entertainment Golf | | Debt Investments (A)(B) | | Corporate | | Total |
Year Ended December 31, 2016 | | | | | | | | | |
Revenues | | | | | | | | |
|
|
Golf course operations | $ | 226,255 |
| | $ | — |
| | $ | — |
| | $ | — |
| | $ | 226,255 |
|
Sales of food and beverages | 72,625 |
| | — |
| | — |
| | — |
| | 72,625 |
|
Total revenues | 298,880 |
| | — |
| | — |
| | — |
| | 298,880 |
|
Operating costs | | | | | | | | | — |
|
Operating expenses (C) | 254,353 |
| | — |
| | — |
| | — |
| | 254,353 |
|
Cost of sales - food and beverages | 21,593 |
| | — |
| | — |
| | — |
| | 21,593 |
|
General and administrative expense | 2,708 |
| | 12 |
| | 93 |
| | 6,675 |
| | 9,488 |
|
General and administrative expense - acquisition and transaction expenses (D) | 1,594 |
| | 1,555 |
| | — |
| | 1,205 |
| | 4,354 |
|
Management fee to affiliate | — |
| | — |
| | — |
| | 10,704 |
| | 10,704 |
|
Depreciation and amortization | 26,496 |
| | — |
| | — |
| | — |
| | 26,496 |
|
Impairment (reversal) | 6,232 |
| | — |
| | 4,149 |
| | — |
| | 10,381 |
|
Realized/unrealized (gain) loss on investments | (294 | ) | | — |
| | 979 |
| | — |
| | 685 |
|
Total operating costs | 312,682 |
| | 1,567 |
| | 5,221 |
| | 18,584 |
| | 338,054 |
|
Operating loss | (13,802 | ) | | (1,567 | ) | | (5,221 | ) | | (18,584 | ) | | (39,174 | ) |
Other income (expenses) | | | | | | | | | — |
|
Interest and investment income | 134 |
| | — |
| | 91,107 |
| | 50 |
| | 91,291 |
|
Interest expense | (12,470 | ) | | — |
| | (38,112 | ) | | (2,286 | ) | | (52,868 | ) |
Loss on extinguishment of debt | (780 | ) | | — |
| | — |
| | — |
| | (780 | ) |
Gain on deconsolidation | — |
| | — |
| | 82,130 |
| | — |
| | 82,130 |
|
Other loss, net | (2,379 | ) | | — |
| | (695 | ) | | — |
| | (3,074 | ) |
Total other income (expenses) | (15,495 | ) | | — |
| | 134,430 |
| | (2,236 | ) | | 116,699 |
|
Income tax expense | 188 |
| | 1 |
| | — |
| | — |
| | 189 |
|
Income (loss) from continuing operations | (29,485 | ) | | (1,568 | ) | | 129,209 |
| | (20,820 | ) | | 77,336 |
|
Income from discontinued operations, net of tax | — |
| | — |
| | — |
| | — |
| | — |
|
Net income (loss) | (29,485 | ) | | (1,568 | ) | | 129,209 |
| | (20,820 | ) | | 77,336 |
|
Preferred dividends | — |
| | — |
| | — |
| | (5,580 | ) | | (5,580 | ) |
Net income attributable to noncontrolling interest | (257 | ) | | — |
| | — |
| | — |
| | (257 | ) |
Income (loss) applicable to common stockholders | $ | (29,742 | ) | | $ | (1,568 | ) | | $ | 129,209 |
| | $ | (26,400 | ) | | $ | 71,499 |
|
| | | | | | | | | |
December 31, 2016 | | | | | | | | | |
Investments | $ | 282,064 |
| | $ | 659 |
| | $ | 704,122 |
| | $ | — |
| | $ | 986,845 |
|
Cash and restricted cash | 24,484 |
| | — |
| | 192 |
| | 121,868 |
| | 146,544 |
|
Other assets | 34,487 |
| | 766 |
| | 3,219 |
| | 97 |
| | 38,569 |
|
Total assets | 341,035 |
| | 1,425 |
| | 707,533 |
| | 121,965 |
| | 1,171,958 |
|
Debt, net | 115,284 |
| | — |
| | 600,964 |
| | 51,217 |
| | 767,465 |
|
Other liabilities | 170,718 |
| | 1,116 |
| | 2,293 |
| | 12,299 |
| | 186,426 |
|
Total liabilities | 286,002 |
| | 1,116 |
| | 603,257 |
| | 63,516 |
| | 953,891 |
|
Preferred stock | — |
| | — |
| | — |
| | 61,583 |
| | 61,583 |
|
Noncontrolling interest | — |
| | — |
| | — |
| | — |
| | — |
|
Equity (deficit) attributable to common stockholders | $ | 55,033 |
| | $ | 309 |
| | $ | 104,276 |
| | $ | (3,134 | ) | | $ | 156,484 |
|
| | | | | | | | | |
Additions to investments in real estate during the year ended December 31, 2016 | $ | 11,912 |
| | $ | 659 |
| | $ | — |
| | $ | — |
| | $ | 12,571 |
|
DRIVE SHACK INC. AND SUBSIDIARIES
NOTES TO CONSOLIDATED FINANCIAL STATEMENTS
DECEMBER 31, 2016, 2015 and 2014
(dollars in tables in thousands, except per share data)
Summary segment financial data (continued).
|
| | | | | | | | | | | | | | | | | | | | | | | | | | | |
| Traditional Golf | | Entertainment Golf | | Debt Investments (A)(B) | | Corporate | | Discontinued Operations | | Eliminations | | Total |
Year Ended December 31, 2015 | | | | | | | | | | | | | |
Revenues | | | | | | | | | | | | | |
Golf course operations | $ | 224,419 |
| | $ | — |
| | $ | — |
| | $ | — |
| | $ | — |
| | $ | — |
| | $ | 224,419 |
|
Sales of food and beverages | 71,437 |
| | — |
| | — |
| | — |
| | — |
| | — |
| | 71,437 |
|
Total revenues | 295,856 |
| | — |
| | — |
| | — |
| | — |
| | — |
| | 295,856 |
|
Operating costs | | | | | | | | | | | | | |
Operating expenses (C) | 254,553 |
| | — |
| | — |
| | — |
| | — |
| | — |
| | 254,553 |
|
Cost of sales - food and beverages | 22,549 |
| | — |
| | — |
| | — |
| | — |
| | — |
| | 22,549 |
|
General and administrative expense | 2,983 |
| | — |
| | 291 |
| | 7,640 |
| | — |
| | — |
| | 10,914 |
|
General and administrative expense - acquisition and transaction expenses (D) | 1,364 |
| | — |
| | 60 |
| | (301 | ) | | — |
| | — |
| | 1,123 |
|
Management fee to affiliate | — |
| | — |
| | — |
| | 10,692 |
| | — |
| | — |
| | 10,692 |
|
Depreciation and amortization | 28,682 |
| | — |
| | — |
| | (48 | ) | | — |
| | — |
| | 28,634 |
|
Impairment (reversal) | — |
| | — |
| | 11,896 |
| | — |
| | — |
| | — |
| | 11,896 |
|
Realized/unrealized (gain) loss on investments | 9 |
| | — |
| | (22,273 | ) | | — |
| | — |
| | — |
| | (22,264 | ) |
Total operating costs | 310,140 |
| | — |
| | (10,026 | ) | | 17,983 |
| | — |
| | — |
| | 318,097 |
|
Operating income (loss) | (14,284 | ) | | — |
| | 10,026 |
| | (17,983 | ) | | — |
| | — |
| | (22,241 | ) |
Other income (expenses) | | | | | | | | | | | | | |
Interest and investment income | 152 |
| | — |
| | 98,721 |
| | 23 |
| | — |
| | (3,005 | ) | | 95,891 |
|
Interest expense | (16,520 | ) | | — |
| | (44,831 | ) | | (3,783 | ) | | — |
| | 3,005 |
| | (62,129 | ) |
Gain on extinguishment of debt | 14,818 |
| | — |
| | 488 |
| | — |
| | — |
| | — |
| | 15,306 |
|
Other income (loss), net | (1,629 | ) | | — |
| | (3,999 | ) | | 54 |
| | — |
| | — |
| | (5,574 | ) |
Inter-segment elimination | 3,005 |
| | — |
| | (3,005 | ) | | — |
| | — |
| | — |
| | — |
|
Total other income (expenses) | (174 | ) | | — |
| | 47,374 |
| | (3,706 | ) | | — |
| | — |
| | 43,494 |
|
Income tax expense | 345 |
| | — |
| | — |
| | — |
| | — |
| | — |
| | 345 |
|
Income (loss) from continuing operations | (14,803 | ) | | — |
| | 57,400 |
| | (21,689 | ) | | — |
| | — |
| | 20,908 |
|
Income from discontinued operations, net of tax | — |
| | — |
| | — |
| | — |
| | 646 |
| | — |
| | 646 |
|
Net income (loss) | (14,803 | ) | | — |
| | 57,400 |
| | (21,689 | ) | | 646 |
| | — |
| | 21,554 |
|
Preferred dividends | — |
| | — |
| | — |
| | (5,580 | ) | | — |
| | — |
| | (5,580 | ) |
Net loss attributable to noncontrolling interest | 293 |
| | — |
| | — |
| | — |
| | — |
| | — |
| | 293 |
|
Income (loss) applicable to common stockholders | $ | (14,510 | ) | | $ | — |
| | $ | 57,400 |
| | $ | (27,269 | ) | | $ | 646 |
| | $ | — |
| | $ | 16,267 |
|
| | | | | | | | | | | | | |
December 31, 2015 | | | | | | | | | | | | | |
Investments, net | $ | 302,379 |
| | $ | — |
| | $ | 715,596 |
| | $ | — |
| | $ | — |
| | $ | — |
| | $ | 1,017,975 |
|
Cash and restricted cash | 19,981 |
| | — |
| | 1,210 |
| | 28,929 |
| | — |
| | — |
| | 50,120 |
|
Other assets | 33,765 |
| | — |
| | 365,713 |
| | 409 |
| | — |
| | — |
| | 399,887 |
|
Total assets | 356,125 |
| | — |
| | 1,082,519 |
| | 29,338 |
| | — |
| | — |
| | 1,467,982 |
|
Debt, net | 81,091 |
| | — |
| | 838,526 |
| | 51,225 |
| | — |
| | — |
| | 970,842 |
|
Other liabilities | 166,973 |
| | — |
| | 107,154 |
| | 12,891 |
| | — |
| | — |
| | 287,018 |
|
Total liabilities | 248,064 |
| | — |
| | 945,680 |
| | 64,116 |
| | — |
| | — |
| | 1,257,860 |
|
Preferred stock | — |
| | — |
| | — |
| | 61,583 |
| | — |
| | — |
| | 61,583 |
|
Noncontrolling interest | (257 | ) | | — |
| | — |
| | — |
| | — |
| | — |
| | (257 | ) |
Equity (deficit) attributable to common stockholders | $ | 108,318 |
| | $ | — |
| | $ | 136,839 |
| | $ | (96,361 | ) | | $ | — |
| | $ | — |
| | $ | 148,796 |
|
| | | | | | | | | | | | | |
Additions to investment in real estate for the year ended December 31, 2015 | $ | 7,637 |
| | $ | — |
| | $ | — |
| | $ | — |
| | $ | — |
| | $ | — |
| | $ | 7,637 |
|
DRIVE SHACK INC. AND SUBSIDIARIES
NOTES TO CONSOLIDATED FINANCIAL STATEMENTS
DECEMBER 31, 2016, 2015 and 2014
(dollars in tables in thousands, except per share data)
Summary segment financial data (continued).
|
| | | | | | | | | | | | | | | | | | | | | | | | | | | |
| | | | | | | | | | | | | |
| Traditional Golf | | Entertainment Golf | | Debt Investments (A)(B) | | Corporate | | Discontinued Operations | | Eliminations | | Total |
Year Ended December 31, 2014 | | | | | | | | | | | | | |
Revenues | | | | | | | | | | | | | |
Golf course operations | $ | 222,983 |
| | $ | — |
| | $ | — |
| | $ | — |
| | $ | — |
| | $ | — |
| | $ | 222,983 |
|
Sales of food and beverages | 68,554 |
| | — |
| | — |
| | — |
| | — |
| | — |
| | 68,554 |
|
Total revenues | 291,537 |
| | — |
| | — |
| | — |
| | — |
| | — |
| | 291,537 |
|
Operating costs | | | | | | | | | | | | | |
Operating expenses (C) | 263,338 |
| | — |
| | — |
| | — |
| | — |
| | — |
| | 263,338 |
|
Cost of sales - food and beverages | 21,037 |
| | — |
| | — |
| | — |
| | — |
| | — |
| | 21,037 |
|
General and administrative expense | 1,435 |
| | — |
| | 1,215 |
| | 7,722 |
| | — |
| | — |
| | 10,372 |
|
General and administrative expense - acquisition and transaction expenses (D) | 1,941 |
| | — |
| | 2,919 |
| | 619 |
| | — |
| | — |
| | 5,479 |
|
Management fee to affiliate | — |
| | — |
| | — |
| | 21,039 |
| | — |
| | — |
| | 21,039 |
|
Depreciation and amortization | 26,880 |
| | — |
| | — |
| | 87 |
| | — |
| | — |
| | 26,967 |
|
Impairment (reversal) | — |
| | — |
| | (2,419 | ) | | — |
| | — |
| | — |
| | (2,419 | ) |
Realized/unrealized (gain) loss on investments | — |
| | — |
| | (69,593 | ) | | — |
| | — |
| | — |
| | (69,593 | ) |
Total operating costs | 314,631 |
| | — |
| | (67,878 | ) | | 29,467 |
| | — |
| | — |
| | 276,220 |
|
Operating income (loss) | (23,094 | ) | | — |
| | 67,878 |
| | (29,467 | ) | | — |
| | — |
| | 15,317 |
|
Other income (expenses) | | | | | | | | | | | | | |
Interest and investment income | 147 |
| | — |
| | 135,031 |
| | 44 |
| | — |
| | (7,595 | ) | | 127,627 |
|
Interest expense | (19,783 | ) | | — |
| | (64,016 | ) | | (3,818 | ) | | — |
| | 7,595 |
| | (80,022 | ) |
Loss on extinguishment of debt | — |
| | — |
| | (3,410 | ) | | — |
| | — |
| | — |
| | (3,410 | ) |
Other income, net | 5,863 |
| | — |
| | 2,416 |
| | — |
| | — |
| | — |
| | 8,279 |
|
Inter-segment elimination | 5,734 |
| | — |
| | (5,734 | ) | | — |
| | — |
| | — |
| | — |
|
Total other income (expenses) | (8,039 | ) | | — |
| | 64,287 |
| | (3,774 | ) | | — |
| | — |
| | 52,474 |
|
Income tax expense | 208 |
| | — |
| | — |
| | — |
| | — |
| | — |
| | 208 |
|
Income (loss) from continuing operations | (31,341 | ) | | — |
| | 132,165 |
| | (33,241 | ) | | — |
| | — |
| | 67,583 |
|
Loss from discontinued operations, net of tax | — |
| | — |
| | — |
| | — |
| | (35,189 | ) | | — |
| | (35,189 | ) |
Net income (loss) | (31,341 | ) | | — |
| | 132,165 |
| | (33,241 | ) | | (35,189 | ) | | — |
| | 32,394 |
|
Preferred dividends | — |
| | — |
| | — |
| | (5,580 | ) | | — |
| | — |
| | (5,580 | ) |
Net loss attributable to noncontrolling interest | 329 |
| | — |
| | — |
| | — |
| | 523 |
| | — |
| | 852 |
|
Income (loss) applicable to common stockholders | $ | (31,012 | ) | | $ | — |
| | $ | 132,165 |
| | $ | (38,821 | ) | | $ | (34,666 | ) | | $ | — |
| | $ | 27,666 |
|
| | | | | | | | | | | | | |
Additions to investment in real estate during the year ended December 31, 2014 | $ | 7,925 |
| | $ | — |
| | $ | — |
| | $ | — |
| | $ | 307,529 |
| | $ | — |
| | $ | 315,454 |
|
| |
(A) | Assets held within non-recourse structures, are not available to satisfy obligations outside of such financings, except to the extent net cash flow distributions are received from such structures. Furthermore, creditors or beneficial interest holders of these structures generally have no recourse to the general credit of the Company. Therefore, the exposure to the economic losses from such structures generally is limited to invested equity in them and economically their book value cannot be less than zero. Therefore, impairment recorded in excess of Drive Shack Inc.’s investment, which results in negative GAAP book value for a given non-recourse financing structure, cannot economically be incurred and will eventually be reversed through amortization, sales at gains, or as gains at the deconsolidation or termination of such non-recourse financing structure. |
DRIVE SHACK INC. AND SUBSIDIARIES
NOTES TO CONSOLIDATED FINANCIAL STATEMENTS
DECEMBER 31, 2016, 2015 and 2014
(dollars in tables in thousands, except per share data)
| |
(B) | The following table summarizes the investments and debt in the Debt Investments segment: |
|
| | | | | | | | | | | | | | | | | | | | | | | | | | | | | | | | | |
| December 31, 2016 | | December 31, 2015 |
| Investments | | Debt | | Investments | | Debt |
Non-Recourse | Outstanding
Face Amount | | Carrying
Value | | Outstanding
Face Amount | | Carrying
Value | | Outstanding
Face Amount | | | Carrying
Value | | Outstanding
Face Amount | | | Carrying
Value |
Subprime mortgage loans subject to call options | — |
| | — |
| | — |
| | — |
| | 380,806 |
| | | 380,806 |
| | 380,806 |
| | | 380,806 |
|
Other | | | | | | | | | | | | | | | | | |
Unlevered real estate securities | 4,000 |
| | 1,950 |
| | — |
| | — |
| | 107,242 |
| (E) | | 59,034 |
| | 97,917 |
| | | 97,605 |
|
Levered real estate securities | 619,808 |
| | 627,304 |
| | 600,964 |
| | 600,964 |
| | 102,660 |
| (F) | | 105,963 |
| | 348,625 |
| (F) | | 348,625 |
|
Real estate related and other loans (G) | 74,695 |
| | 55,612 |
| | — |
| | — |
| | 174,995 |
| | | 149,198 |
| | 11,660 |
| | | 11,490 |
|
Other investments | N/A |
| | 19,256 |
| | — |
| | — |
| | N/A |
| | | 20,595 |
| | — |
| | | — |
|
| $ | 698,503 |
| | $ | 704,122 |
| | $ | 600,964 |
| | $ | 600,964 |
| | $ | 765,703 |
| | | $ | 715,596 |
| | $ | 839,008 |
| | | $ | 838,526 |
|
| |
(C) | Operating expenses includes rental expenses recorded under operating leases for carts and equipment in the amount of $3.8 million, $4.6 million and $5.0 million for the years ended December 31, 2016, 2015 and 2014, respectively. |
| |
(D) | Acquisition and transaction expense includes costs related to completed and potential acquisitions and transactions which may include advisory, legal, accounting, valuation and other professional or consulting fees. Transaction expense also includes costs which do not qualify for capitalization associated with the development of new entertainment golf venues. |
| |
(E) | Excludes eight securities with zero value, which had an aggregate face amount of $116.0 million. The Company sold these securities during 2016. |
| |
(F) | These investments represent purchases that were traded on December 31, 2015 but settled on January 13, 2016. The debts represent repurchase agreements collateralized by sold investments that were traded on December 31, 2015 and settled on January 13, 2016. See Note 5 for additional detail. |
| |
(G) | Excludes two mezzanine loans with zero value, which had an aggregate face amount of $17.8 million and two corporate loans with zero value, which had an aggregate face amount of $45.7 million. |
DRIVE SHACK INC. AND SUBSIDIARIES
NOTES TO CONSOLIDATED FINANCIAL STATEMENTS
DECEMBER 31, 2016, 2015 and 2014
(dollars in tables in thousands, except per share data)
5. REAL ESTATE SECURITIES
The following is a summary of Drive Shack Inc.’s real estate securities at December 31, 2016 and 2015, all of which are classified as available for sale and are, therefore, reported at fair value with changes in fair value recorded in other comprehensive income, except for securities that are other-than-temporarily impaired.
|
| | | | | | | | | | | | | | | | | | | | | | | | | | | | | | | | | | | | | | | | | | | | | |
| | | | Amortized Cost Basis | | Gross Unrealized | | | | | | Weighted Average |
Asset Type | | Outstanding
Face Amount | | Before
Impairment | | Other-Than-
Temporary-
Impairment (A) | | After
Impairment | | Gains | | Losses | | Carrying Value
(B) | | Number of
Securities | | Rating
(C) | | Coupon | | Yield | | Life
(Years)
(D) | | Principal
Subordination
(E) |
December 31, 2016 | | | | | | | | | | | | | | | | | | | | | | | | | | |
ABS - Non-Agency RMBS | | $ | 4,000 |
| | $ | 2,303 |
| | $ | (1,521 | ) | | $ | 782 |
| | $ | 1,168 |
| | $ | — |
| | $ | 1,950 |
| | 1 |
| | C | | 1.15 | % | | 25.45 | % | | 9.0 |
| | 27.9 | % |
Debt Security Total/Average (F) | | $ | 4,000 |
| | $ | 2,303 |
| | $ | (1,521 | ) | | $ | 782 |
| | $ | 1,168 |
| | $ | — |
| | $ | 1,950 |
| | 1 |
| | C | | 1.15 | % | | 25.45 | % | | 9.0 |
| | |
Equity Securities | | | | — |
| | — |
| | — |
| | — |
| | — |
| | — |
| | 1 |
| | | | | | | | | | |
Total Securities, Available-for-Sale | | | | $ | 2,303 |
| | $ | (1,521 | ) | | $ | 782 |
| | $ | 1,168 |
| | $ | — |
| | $ | 1,950 |
| | 2 |
| | | | | | | | | | |
| | | | | | | | | | | | | | | | | | | | | | | | | | |
FNMA/FHLMC (A) | | 619,808 |
| | 650,432 |
| | (23,128 | ) | | 627,304 |
| | — |
| | — |
| | 627,304 |
| | 15 |
| | AAA | | 3.28 | % | | 2.65 | % | | 8.4 |
| | N/A |
|
Total Securities, Pledged as Collateral (F) | | $ | 619,808 |
| | $ | 650,432 |
| | $ | (23,128 | ) | | $ | 627,304 |
| | $ | — |
| | $ | — |
| | $ | 627,304 |
| | 15 |
| | | | | | | | | | |
| | | | | | | | | | | | | | | | | | | | | | | | | | |
December 31, 2015 | | | | | | | | | | | | | | | | | | | | | | | | | | |
CMBS | | $ | 67,669 |
| | $ | 78,416 |
| | $ | (55,372 | ) | | $ | 23,044 |
| | $ | 16,673 |
| | $ | (33 | ) | | $ | 39,684 |
| | 16 |
| | B | | 4.97 | % | | 14.78 | % | | 2.1 |
| | 26.1 | % |
ABS - Non-Agency RMBS | | 16,477 |
| | 23,403 |
| | (20,667 | ) | | 2,736 |
| | 6,958 |
| | (75 | ) | | 9,619 |
| | 9 |
| | CC | | 1.89 | % | | 11.95 | % | | 11.0 |
| | 9.7 | % |
ABS-Small Business Loans | | 8,464 |
| | 7,647 |
| | (7,647 | ) | | — |
| | — |
| | — |
| | — |
| | 1 |
| | C | | 6.69 | % | | — | % | | — |
| | — | % |
CDO (F) | | 14,632 |
| | — |
| | — |
| | — |
| | 9,731 |
| | — |
| | 9,731 |
| | 2 |
| | C | | 1.80 | % | | — | % | | 7.2 |
| | 25.1 | % |
Debt Security Total/Average (F) | | $ | 107,242 |
| | $ | 109,466 |
| | $ | (83,686 | ) | | $ | 25,780 |
| | $ | 33,362 |
| | $ | (108 | ) | | $ | 59,034 |
| | 28 |
| | CCC+ | | 4.20 | % | | 14.48 | % | | 4.0 |
| | |
Equity Securities | | | | — |
| | — |
| | — |
| | — |
| | — |
| | — |
| | 2 |
| | | | | | | | | | |
Total Securities, Available-for-Sale | | | | $ | 109,466 |
| | $ | (83,686 | ) | | $ | 25,780 |
| | $ | 33,362 |
| | $ | (108 | ) | | $ | 59,034 |
| | 30 |
| | | | | | | | | | |
| | | | | | | | | | | | | | | | | | | | | | | | | | |
FNMA/FHLMC | | 102,660 |
| | 105,940 |
| | — |
| | 105,940 |
| | 23 |
| | — |
| | 105,963 |
| | 3 |
| | AAA | | 3.50 | % | | 2.99 | % | | 7.8 |
| | N/A |
|
Total Securities, Pledged as Collateral (F) | | $ | 102,660 |
| | $ | 105,940 |
| | $ | — |
| | $ | 105,940 |
| | $ | 23 |
| | $ | — |
| | $ | 105,963 |
| | 3 |
| | | | | | | | | | |
| | | | | | | | | | | | | | | | | | | | | | | | | | |
| |
(A) | In December 2016, Drive Shack Inc. reclassified gross unrealized losses of $23.1 million from other comprehensive income into earnings on FNMA/FHLMC securities that the Company intends to sell and recorded in realized/unrealized (gain) loss on investments in the Consolidated Statements of Operations. |
| |
(B) | See Note 10 regarding the estimation of fair value, which is equal to carrying value for all securities. |
| |
(C) | Represents the weighted average of the ratings of all securities in each asset type, expressed as an S&P equivalent rating. For each security rated by multiple rating agencies, the lowest rating is used. Drive Shack Inc. used an implied AAA rating for the FNMA/FHLMC securities. Ratings provided were determined by third party rating agencies, represent the most recent credit ratings available as of the reporting date and may not be current. |
| |
(D) | The weighted average life is based on the timing of expected cash flows on the assets. |
| |
(E) | Percentage of the outstanding face amount of securities and residual interests that is subordinate to Drive Shack Inc.’s investments. |
| |
(F) | As of December 31, 2016 and 2015, the total outstanding face amount of fixed rate securities was $619.8 million and $168.5 million, respectively, and of floating rate securities were $4.0 million and $41.4 million, respectively. |
| |
(G) | Excludes eight CDO securities with zero value which had an aggregate face amount of $116.0 million as of December 31, 2015. The Company sold these securities during 2016. |
Unrealized losses that are considered other-than-temporary are recognized currently in earnings. During the years ended December 31, 2016, 2015 and 2014, Drive Shack Inc. recorded other-than-temporary impairment charges (“OTTI”) of $23.1 million, $2.4 million and $0.0 million, respectively, (gross of $0.0 million, less than $0.1 million and $0.0 million of other-than-temporary impairment recognized (reversed) in other comprehensive income in 2016, 2015 and 2014, respectively). Based on
DRIVE SHACK INC. AND SUBSIDIARIES
NOTES TO CONSOLIDATED FINANCIAL STATEMENTS
DECEMBER 31, 2016, 2015 and 2014
(dollars in tables in thousands, except per share data)
management’s analysis of the securities, the performance of the underlying loans and changes in market factors, Drive Shack Inc. noted adverse changes in the expected cash flows on certain of these securities and concluded that they were other-than-temporarily impaired. Any remaining unrealized losses as of each balance sheet date on Drive Shack Inc.’s securities were primarily the result of changes in market factors, rather than issuer-specific credit impairment. Drive Shack Inc. performed analyses in relation to such securities, using management’s best estimate of their cash flows, which support that the carrying values of such securities were fully recoverable over their expected holding period. The following table summarizes Drive Shack Inc.’s securities in an unrealized loss position as of December 31, 2016.
|
| | | | | | | | | | | | | | | | | | | | | | | | | | | | | | | | | | | | | | | | | |
| | | Amortized Cost Basis | | Gross Unrealized | | | | | | Weighted Average |
Securities in
an Unrealized
Loss Position | Outstanding
Face
Amount | | Before
Impairment | | Other-than-
Temporary
Impairment (A) | | After
Impairment | | Gains | | Losses | | Carrying
Value | | Number
of
Securities | | Rating | | Coupon | | Yield | | Life
(Years) |
Less Than Twelve Months | $ | 619,808 |
| | $ | 650,432 |
| | $ | (23,128 | ) | | $ | 627,304 |
| | $ | — |
| | $ | — |
| | $ | 627,304 |
| | 15 |
| | AAA | | 3.28 | % | | 2.65 | % | | 8.4 |
|
Twelve or More Months | — |
| | — |
| | — |
| | — |
| | — |
| | — |
| | — |
| | — |
| | — | | — | | — | | — |
|
Total | $ | 619,808 |
| | $ | 650,432 |
| | $ | (23,128 | ) | | $ | 627,304 |
| | $ | — |
| | $ | — |
| | $ | 627,304 |
| | 15 |
| | AAA | | 3.28 | % | | 2.65 | % | | 8.4 |
|
Drive Shack Inc. performed an assessment of all of its debt securities that are in an unrealized loss position (unrealized loss position exists when a security’s amortized cost basis, excluding the effect of OTTI, exceeds its fair value) and determined the following:
|
| | | | | | | | | | | | | | | |
| December 31, 2016 |
| | | Amortized Cost Basis | | Unrealized Losses |
| Fair Value | | After Impairment | | Credit (C) | | Non-Credit (D) |
Securities Drive Shack Inc.intends to sell (A) | $ | 627,304 |
| | $ | 627,304 |
| | $ | — |
| | N/A |
|
Securities Drive Shack Inc. is more likely than not to be required to sell (B) | — |
| | — |
| | — |
| | N/A |
|
Securities Drive Shack Inc. has no intent to sell and is not more likely than not to be required to sell: | | | | | | | |
Credit impaired securities | — |
| | — |
| | — |
| | — |
|
Non-credit impaired securities | — |
| | — |
| | — |
| | — |
|
Total debt securities in an unrealized loss position | $ | 627,304 |
| | $ | 627,304 |
| | $ | — |
| | $ | — |
|
| |
(A) | In December 2016, Drive Shack Inc. reclassified gross unrealized losses of $23.1 million from other comprehensive income into earnings on FNMA/FHLMC securities that the Company intends to sell and recorded in realized/unrealized (gain) loss on investments in the Consolidated Statements of Operations. |
| |
(B) | Drive Shack Inc. may, at times, be more likely than not to be required to sell certain securities for liquidity purposes. While the amount of the securities to be sold may be an estimate, and the securities to be sold have not yet been identified, Drive Shack Inc. must make its best estimate, which is subject to significant judgment regarding future events, and may differ materially from actual future sales. |
| |
(C) | This amount is required to be recorded as other-than-temporary impairment through earnings. In measuring the portion of credit losses, Drive Shack Inc.’s management estimates the expected cash flow for each of the securities. This evaluation includes a review of the credit status and the performance of the collateral supporting those securities, including the credit of the issuer, key terms of the securities and the effect of local, industry and broader economic trends. Significant inputs in estimating the cash flows include management’s expectations of prepayment speeds, default rates and loss severities. Credit losses are measured as the decline in the present value of the expected future cash flows discounted at the investment’s effective interest rate. |
| |
(D) | This amount represents unrealized losses on securities that are due to non-credit factors and is required to be recorded through other comprehensive income. |
DRIVE SHACK INC. AND SUBSIDIARIES
NOTES TO CONSOLIDATED FINANCIAL STATEMENTS
DECEMBER 31, 2016, 2015 and 2014
(dollars in tables in thousands, except per share data)
The following table summarizes the activity related to credit losses on debt securities:
|
| | | | | | | |
| 2016 | | 2015 |
Beginning balance of credit losses on debt securities for which a portion of an OTTI was recognized in other comprehensive income | $ | (3,010 | ) | | $ | (4,174 | ) |
| | | |
Additions for credit losses on securities for which an OTTI was not previously recognized | — |
| | (1,567 | ) |
| | | |
Additions to credit losses on securities for which an OTTI was previously recognized and a portion of an OTTI was recognized in other comprehensive income | (110 | ) | | — |
|
| | | |
Additions for credit losses on securities for which an OTTI was previously recognized without any portion of OTTI recognized in other comprehensive income | — |
| | (1,443 | ) |
| | | |
Reduction for credit losses on securities for which no OTTI was recognized in other comprehensive income at the current measurement date | — |
| | 4,174 |
|
| | | |
Reduction for securities deconsolidated during the period | 3,120 |
| | — |
|
| | | |
Reduction for securities sold/written off during the period | — |
| | — |
|
| | | |
Reduction for increases in cash flows expected to be collected that are recognized over the remaining life of the security | — |
| | — |
|
| | | |
Ending balance of credit losses on debt securities for which a portion of an OTTI was recognized in other comprehensive income | $ | — |
| | $ | (3,010 | ) |
The table below summarizes the geographic distribution of the collateral securing the ABS at December 31, 2016:
|
| | | | | | | |
| | ABS - Non-Agency RMBS |
Geographic Location | | Outstanding Face Amount | | Percentage |
Northeastern U.S. | | $ | 623 |
| | 15.6 | % |
Southeastern U.S. | | 1,056 |
| | 26.4 | % |
Midwestern U.S. | | 426 |
| | 10.7 | % |
Western U.S. | | 1,297 |
| | 32.4 | % |
Southwestern U.S. | | 598 |
| | 14.9 | % |
| | $ | 4,000 |
| | 100.0 | % |
Geographic concentrations of investments expose Drive Shack Inc. to the risk of economic downturns within the relevant regions, particularly given the current unfavorable market conditions. These market conditions may make regions more vulnerable to downturns in certain market factors. Any such downturn in a region where Drive Shack Inc. holds significant investments could have a material, negative impact on Drive Shack Inc.
DRIVE SHACK INC. AND SUBSIDIARIES
NOTES TO CONSOLIDATED FINANCIAL STATEMENTS
DECEMBER 31, 2016, 2015 and 2014
(dollars in tables in thousands, except per share data)
The table below summarizes the FNMA/FHLMC activity for the years ended December 31, 2016 and 2015 (dollars in millions):
|
| | | | | | | | | | | | | | | | | | | | | |
Settlement Date | | Activity | | Face Amount of FNMA/FHLMC Purchased (Sold) | | Average Price % of Par | | Total Proceeds (Payment) | | Gain (Loss) | | Repurchase Agreement Financed (Repaid) |
March 2015 (A) | | Sale | | $ | (380.4 | ) | | 104.7 | % | | $ | 398.4 |
| | $ | 5.9 |
| | $ | (385.6 | ) |
March 2015 | | Purchase | | $ | 389.1 |
| | 104.8 | % | | $ | (407.6 | ) | | N/A |
| | $ | 386.1 |
|
July 2015 (B) | | Sale | | $ | (380.4 | ) | | 103.1 | % | | $ | 392.3 |
| | $ | (5.9 | ) | | $ | (375.7 | ) |
July 2015 | | Purchase | | $ | 403.9 |
| | 102.9 | % | | $ | (415.6 | ) | | N/A |
| | $ | 393.8 |
|
July 2015 | | Purchase | | $ | 201.9 |
| | 102.9 | % | | $ | (207.7 | ) | | N/A |
| | $ | 196.7 |
|
September 2015 (A) | | Sale | | $ | (250.4 | ) | | 103.8 | % | | $ | 260.0 |
| | $ | 2.5 |
| | $ | (250.1 | ) |
October 2015 (B) | | Sale | | $ | (348.9 | ) | | 104.3 | % | | $ | 364.0 |
| | $ | 5.1 |
| | $ | (345.9 | ) |
October 2015 | | Purchase | | $ | 354.8 |
| | 104.4 | % | | $ | (370.5 | ) | | N/A |
| | $ | 352.6 |
|
January 2016 (B) | | Sale | | $ | (350.3 | ) | | 103.2 | % | | $ | 361.3 |
| | $ | (3.9 | ) | | $ | (348.6 | ) |
January 2016 | | Purchase | | $ | 102.7 |
| | 103.2 | % | | $ | (105.9 | ) | | N/A |
| | $ | 102.2 |
|
January 2016 | | Purchase | | $ | 250.1 |
| | 103.2 | % | | $ | (258.1 | ) | | N/A |
| | $ | 249.1 |
|
April 2016 (B) | | Sale | | $ | (347.5 | ) | | 104.9 | % | | $ | 364.3 |
| | $ | 5.9 |
| | $ | (352.0 | ) |
April 2016 | | Purchase | | $ | 363.1 |
| | 105.0 | % | | $ | (381.1 | ) | | N/A |
| | $ | 366.4 |
|
July 2016 (B) | | Sale | | $ | (353.6 | ) | | 105.5 | % | | $ | 373.1 |
| | $ | 1.8 |
| | $ | (361.1 | ) |
July 2016 | | Purchase | | $ | 428.9 |
| | 105.7 | % | | $ | (453.1 | ) | | N/A |
| | $ | 434.9 |
|
August 2016 | | Purchase | | $ | 249.6 |
| | 103.9 | % | | $ | (259.3 | ) | | N/A |
| | $ | 248.7 |
|
August 2016 | | Purchase | | $ | 116.8 |
| | 105.7 | % | | $ | (123.5 | ) | | N/A |
| | $ | 118.6 |
|
September 2016 | | Purchase | | $ | 35.6 |
| | 103.8 | % | | $ | (37.0 | ) | | N/A |
| | $ | 35.4 |
|
October 2016 | | Purchase | | $ | 776.9 |
| | 103.6 | % | | $ | (805.1 | ) | | N/A |
| | $ | 769.6 |
|
October 2016 | | Purchase | | $ | 632.2 |
| | 104.9 | % | | $ | (663.5 | ) | | N/A |
| | $ | 628.2 |
|
October 2016 (B) | | Sale | | $ | (817.2 | ) | | 105.0 | % | | $ | 858.2 |
| | $ | 0.1 |
| | $ | (831.7 | ) |
November 2016 (A) | | Sale | | $ | (779.0 | ) | | 101.5 | % | | $ | 790.7 |
| | $ | (16.2 | ) | | $ | (773.7 | ) |
| |
(A) | The gain (loss) on these sales was recorded on the trade date. |
| |
(B) | The gain (loss) on these sales was recorded on the trade date which occurred in the month prior to the settlement date. |
In May 2015, Drive Shack Inc. sold $98.6 million face amount of CMBS securities at an average price of 104.03% of par for total proceeds of $102.6 million, and recognized a gain of $14.0 million. Drive Shack Inc. also sold $42.8 million face amount of ABS -non-agency RMBS securities at an average price of 85.54% of par for total proceeds of $36.7 million, and recognized a gain of $14.1 million. The proceeds from these CMBS and ABS - non-agency RMBS sales were used to repay the associated outstanding notes in CDO VI, CDO VIII and CDO IX.
Additionally in May 2015, Drive Shack Inc. received a $25.0 million par pay down of CMBS securities held in CDO IX. These funds were used to repay the associated outstanding notes in CDO IX.
In May 2015, Drive Shack Inc. also sold $3.9 million face amount of unencumbered ABS - non-agency RMBS at an average price of 24.11% of par for total proceeds of $0.9 million and recognized a gain of $0.8 million.
In June 2016, Drive Shack Inc. sold a CDO bond with a face amount of $10.0 million at a price of 7.25% of par for total proceeds of $0.7 million and reported a gain on sale of $0.7 million, as this bond was previously written down to zero.
In August 2016, Drive Shack Inc. settled on a trade to sell $14.8 million face amount of 2 CDO securities at an average price of 67.3% of par for total proceeds of $9.9 million and recognized a gain on the sale of approximately $9.9 million.
DRIVE SHACK INC. AND SUBSIDIARIES
NOTES TO CONSOLIDATED FINANCIAL STATEMENTS
DECEMBER 31, 2016, 2015 and 2014
(dollars in tables in thousands, except per share data)
In October 2016, Drive Shack Inc. settled on a trade to sell $39.6 million face amount of 4 CDO securities for total proceeds of less than $0.1 million and recognized a gain of less than $0.1 million.
In December 2016, Drive Shack Inc. settled on a trade to sell $8.5 million face amount of a ABS-Small Business Loan security for total proceeds of less than $0.1 million and recognized a gain of less than $0.1 million.
In December 2016, Drive Shack Inc. settled on a trade to sell $10.3 million face amount of 2 CMBS securities for total proceeds of less than $0.1 million and recognized a gain of less than $0.1 million.
Securities Pledged as Collateral
These government agency securities were sold under agreements to repurchase which are treated as collateralized financing transactions. Although being pledged as collateral, securities financed through a repurchase agreement remains on Drive Shack Inc.'s Consolidated Balance Sheets as an asset and cash received from the purchaser is recorded on Drive Shack Inc.'s Consolidated Balance Sheets as a liability.
6. REAL ESTATE RELATED AND OTHER LOANS, RESIDENTIAL MORTGAGE LOANS AND SUBPRIME MORTGAGE LOANS
The following is a summary of real estate related and other loans, residential mortgage loans and subprime mortgage loans. The loans contain various terms, including fixed and floating rates, self-amortizing and interest only. They are generally subject to prepayment.
|
| | | | | | | | | | | | | | | | | | | | | | | | | | | | | | | | | | | | | | | |
| | December 31, 2016 | | December 31, 2015 |
Loan Type | | Outstanding
Face Amount | | Carrying
Value (A) | | Valuation Allowance (Reversal) | | Loan
Count | | Wtd.
Avg
Yield | | Wtd
Avg
Coupon | | Wtd
Avg
Life
(Years) (B) | | Floating Rate
Loans as a %
of Face
Amount | | Delinquent
Face Amount
(C) | | Carrying
Value | | Loan Count | | Wtd. Avg.
Yield |
Mezzanine Loans | | $ | 17,767 |
| | $ | — |
| | $ | — |
| | 2 |
| | 0.00 | % | | 8.39 | % | | 0.0 | | 100.0 | % | | $ | 17,767 |
| | $ | 19,433 |
| | 3 | | 8.00 | % |
Corporate Loans | | 120,381 |
| | 55,612 |
| | 3,826 |
| | 4 |
| | 22.49 | % | | 15.20 | % | | 0.5 | | 0.0 | % | | 59,384 |
| | 129,765 |
| | 4 | | 22.42 | % |
Total Real Estate Related and other Loans Held-for-Sale, Net (D) | | $ | 138,148 |
| | $ | 55,612 |
| | $ | 3,826 |
| | 6 |
| | 22.49 | % | | 14.32 | % | | 0.5 | | 12.9 | % | | $ | 77,151 |
| | $ | 149,198 |
| | 7 | | 20.54 | % |
| | | | | | | | | | | | | | | | | | | | | | | | |
Residential Mortgage Loans Held-for-Sale, Net (E) | | $ | 771 |
| | $ | 231 |
| | $ | 213 |
| | 3 |
| | 3.40 | % | | 3.05 | % | | 1.8 | | 100.0 | % | | $ | 628 |
| | $ | 532 |
| | 4 | | 62.02 | % |
| | | | | | | | | | | | | | | | | | | | | | | | |
Subprime Mortgage Loans Subject to Call Option | | $ | — |
| | $ | — |
| | | | | | | | | | | | | | | | $ | 380,806 |
| | | | |
| |
(A) | The aggregate United States federal income tax basis for such assets at December 31, 2016 was approximately $75.5 million (unaudited). Carrying value includes negligible interest receivable for the residential housing loans. |
| |
(B) | The weighted average maturity is based on the timing of expected cash flows on the assets. |
| |
(C) | Includes loans that are 60 days or more past due (including loans that are in foreclosure and borrowers in bankruptcy) or considered real estate owned (“REO”). As of December 31, 2016 and December 31, 2015, $77.2 million and $63.5 million face amount of real estate related and other loans, respectively, was on non-accrual status. |
| |
(D) | Loans which are more than 3% of the total current carrying value (or $1.7 million) at December 31, 2016 are as follows: |
|
| | | | | | | | | | | | | | | | | | | | | | | |
| | December 31, 2016 |
Loan Type | | Outstanding
Face Amount | | Carrying Value | | Prior Liens | | Loan
Count | | Yield (1) | | Coupon (1) | | Weighted Average
Life (Years) |
Individual Corporate Loan (2) | | $ | 60,997 |
| | $ | 55,465 |
| | $ | 554,480 |
| | 1 |
| | 22.50 | % | | 22.50 | % | | 0.5 |
Others (3) | | 77,151 |
| | 147 |
| | 327,234 |
| | 5 |
| | 20.00 | % | | 7.85 | % | | 0.5 |
| | $ | 138,148 |
| | $ | 55,612 |
| | | | 6 |
| | 22.49 | % | | 14.32 | % | | 0.5 |
| |
(1) | For Others, represents weighted average yield and weighted average coupon. |
DRIVE SHACK INC. AND SUBSIDIARIES
NOTES TO CONSOLIDATED FINANCIAL STATEMENTS
DECEMBER 31, 2016, 2015 and 2014
(dollars in tables in thousands, except per share data)
| |
(2) | Interest accrued to principal balance over life to maturity. Prior Liens reflect indebtedness and other claims on the assets of the related companies which support the Individual Corporate Loan. |
| |
(3) | Various terms of payment. This represents $59.4 million and $17.8 million of corporate loans and mezzanine loans, respectively. Each of the five loans had a carrying value of less than $1.7 million at December 31, 2016. Prior Liens reflect face amounts of third party liens that are senior to Drive Shack Inc.’s position for Others. |
| |
(E) | Loans acquired at a discount for credit quality. Residential mortgage loans held-for-sale, net is recorded in receivables and other assets on the Consolidated Balance Sheets. |
Drive Shack Inc.’s management monitors the credit qualities of the residential loans primarily by using the aging analysis, current trends in delinquencies and the actual loss incurrence rate.
Drive Shack Inc.'s investments in real estate related and other loans were classified as held-for-sale as of December 31, 2016 and December 31, 2015. Loans held-for-sale are carried on the Consolidated Balance Sheets at the lower of cost or fair value.
In June 2015, Drive Shack Inc. sold $12.0 million face amount of commercial real estate related loans from CDO VIII at a price of 100.01% of par for total proceeds of $12.0 million, and recognized a gain of $0.9 million. Drive Shack Inc. also sold $45.7 million face amount of commercial real estate related loans from CDO IX at an average price of 95.35% for total proceeds of $43.5 million, and recognized a gain of $0.6 million. These proceeds were used to repay the outstanding notes in CDO VIII and CDO IX, respectively.
In August 2015, Drive Shack Inc. closed on the sale of two residential mortgage loans with face amount of $3.3 million, for total proceeds of $2.9 million net of transaction expenses.
In April 2016, Drive Shack Inc. sold a mezzanine loan with a face amount of $19.4 million at par. Drive Shack Inc. subsequently repaid $11.7 million of notes payable that were collateralized by the loan.
In September 2016, Drive Shack Inc. received a pay down on a corporate loan in the resorts industry (“the resort-related loan”) in the amount of $109.9 million. As of December 31, 2016, the face amount of the resort-related loan was $61.0 million.
The following is a summary of real estate related and other loans by maturity at December 31, 2016:
|
| | | | | | | | | | | |
Year of Maturity (A) | | Outstanding
Face Amount | | Carrying Value | | Number of
Loans |
Delinquent (B) | | $ | 77,151 |
| | $ | 147 |
| | 5 |
|
2017 | | — |
| | — |
| | — |
|
2018 | | — |
| | — |
| | — |
|
2019 | | 60,997 |
| | 55,465 |
| | 1 |
|
2020 | | — |
| | — |
| | — |
|
2021 | | — |
| | — |
| | — |
|
Thereafter | | — |
| | — |
| | — |
|
Total | | $ | 138,148 |
| | $ | 55,612 |
| | 6 |
|
| |
(A) | Based on the final extended maturity date of each loan investment as of December 31, 2016. |
| |
(B) | Includes loans that are non-performing, in foreclosure, or under bankruptcy. |
DRIVE SHACK INC. AND SUBSIDIARIES
NOTES TO CONSOLIDATED FINANCIAL STATEMENTS
DECEMBER 31, 2016, 2015 and 2014
(dollars in tables in thousands, except per share data)
Activities relating to the carrying value of real estate related and other loans and residential mortgage loans are as follows:
|
| | | | | | | | | | | |
| Held for Sale | | Held for Investment |
| Real Estate
Related Loans | | Residential
Mortgage Loans (A) | | Residential
Mortgage Loans |
Balance at December 31, 2013 | $ | 437,530 |
| | $ | 2,185 |
| | $ | 255,450 |
|
Purchases / additional fundings | — |
| | — |
| | — |
|
Interest accrued to principal balance | 20,830 |
| | — |
| | — |
|
Principal pay downs | (240,937 | ) | | (9,574 | ) | | (9,436 | ) |
Sales | — |
| | (233,349 | ) | | — |
|
Transfer to held-for-sale | — |
| | 246,121 |
| | (246,121 | ) |
Valuation (allowance) reversal on loans | 3,303 |
| | (51 | ) | | (833 | ) |
Accretion of loan discount and other amortization | 8,867 |
| | — |
| | 115 |
|
Other | 607 |
| | (1,478 | ) | | 825 |
|
Balance at December 31, 2014 | $ | 230,200 |
| | $ | 3,854 |
| | $ | — |
|
Purchases / additional fundings | — |
| | — |
| | — |
|
Interest accrued to principal balance | 27,717 |
| | — |
| | — |
|
Principal pay downs | (46,696 | ) | | (134 | ) | | — |
|
Sales | (55,574 | ) | | (2,925 | ) | | — |
|
Valuation allowance on loans | (9,284 | ) | | (257 | ) | | — |
|
Accretion of loan discount and other amortization | 3,203 |
| | — |
| | — |
|
Other | (368 | ) | | (6 | ) | | — |
|
Balance at December 31, 2015 | $ | 149,198 |
| | $ | 532 |
| | $ | — |
|
Purchases / additional fundings | — |
| | — |
| | — |
|
Interest accrued to principal balance | 29,025 |
| | — |
| | — |
|
Principal pay downs | (109,892 | ) | | (40 | ) | | — |
|
Sales | (19,433 | ) | | — |
| | — |
|
Valuation (allowance) reversal on loans | (3,826 | ) | | (213 | ) | | — |
|
Accretion of loan discount and other amortization | 10,540 |
| | — |
| | — |
|
Loss on settlement of loans | — |
| | (48 | ) | | — |
|
Balance at December 31, 2016 | $ | 55,612 |
| | $ | 231 |
| | $ | — |
|
| |
(A) | Residential mortgage loans held-for-sale, net is recorded in receivables and other assets on the Consolidated Balance Sheets. |
DRIVE SHACK INC. AND SUBSIDIARIES
NOTES TO CONSOLIDATED FINANCIAL STATEMENTS
DECEMBER 31, 2016, 2015 and 2014
(dollars in tables in thousands, except per share data)
The following is a rollforward of the related loss allowance:
|
| | | | | | | | | | | | |
| | Held for Sale | | Held for Investment |
| | Real Estate Related and Other Loans | | Residential Mortgage Loans (A) | | Residential Mortgage Loans (B) |
Balance at December 31, 2013 | | $ | (94,037 | ) | | $ | (824 | ) | | $ | (12,247 | ) |
Charge-offs (C) | | 14,808 |
| | 84 |
| | 711 |
|
Transfer to held-for-sale | | — |
| | (12,369 | ) | | 12,369 |
|
Sales | | — |
| | 13,006 |
| | — |
|
Valuation (allowance) reversal on loans | | 3,303 |
| | (51 | ) | | (833 | ) |
Balance at December 31, 2014 | | (75,926 | ) | | (154 | ) | | — |
|
Charge-offs (C) | | 14,345 |
| | 160 |
| | — |
|
Sales | | — |
| | — |
| | — |
|
Valuation (allowance) reversal on loans | | (9,284 | ) | | (257 | ) | | — |
|
Balance at December 31, 2015 | | $ | (70,865 | ) | | $ | (251 | ) | | $ | — |
|
Charge-offs (C) | | — |
| | — |
| | — |
|
Sales | | — |
| | — |
| | — |
|
Valuation (allowance) reversal on loans | | (3,826 | ) | | (213 | ) | | — |
|
Balance at December 31, 2016 | | $ | (74,691 | ) | | $ | (464 | ) | | $ | — |
|
| |
(A) | Residential mortgage loans held-for-sale, net is reported in receivables and other assets on the Consolidated Balance Sheets. |
| |
(B) | The allowance for credit losses was determined based on the guidance for loans acquired with deteriorated credit quality. |
| |
(C) | The charge-offs for real estate related loans represent zero, four and three loans which were written off, sold, restructured, or paid off at a discounted price during 2016, 2015 and 2014, respectively. |
The average carrying amount of Drive Shack Inc.’s real estate related and other loans was approximately $116.6 million, $172.8 million and $270.1 million during 2016, 2015 and 2014, respectively, on which Drive Shack Inc. earned approximately $40.1 million, $36.8 million and $49.3 million of gross interest revenues, respectively. The $40.1 million of gross interest revenues recognized in 2016 includes $10.5 million accretion of discount related to the pay down of the resort-related loan.
The average carrying amount of Drive Shack Inc.’s residential mortgage loans was approximately $0.4 million, $2.4 million and $90.5 million during 2016, 2015 and 2014, respectively, on which Drive Shack Inc. earned approximately $0.1 million, $0.1 million and $8.3 million of gross interest revenues, respectively.
The table below summarizes the geographic distribution of real estate related and other loans and residential loans at December 31, 2016:
|
| | | | | | | | | | | | | | |
| | Real Estate Related and Other Loans | | Residential Mortgage Loans |
Geographic Location | | Outstanding Face Amount | | Percentage | | Outstanding Face Amount | | Percentage |
Northeastern U.S. | | $ | — |
| | 0.0 | % | | $ | 523 |
| | 67.8 | % |
Southeastern U.S. | | — |
| | 0.0 | % | | 248 |
| | 32.2 | % |
Foreign | | 63,454 |
| | 100.0 | % | | — |
| | — |
|
| | $ | 63,454 |
| | 100.0 | % | | $ | 771 |
| | 100.0 | % |
Other | | 74,694 |
| | (A) | | | | |
| | $ | 138,148 |
| | | | | | |
| |
(A) | Includes corporate loans which are not directly secured by real estate assets. |
Securitization of Subprime Mortgage Loans
Drive Shack Inc. acquired and securitized two portfolios of subprime residential mortgage loans (“Subprime Portfolio I” and “Subprime Portfolio II”), through subsidiaries. Both portfolios are being serviced by an affiliate of the Manager for a servicing fee equal to 0.50% per annum on their respective unpaid principal balances.
Both portfolios were securitized through special purpose entities (“Securitization Trust 2006”) and (“Securitization Trust 2007”) which are not consolidated by Drive Shack Inc. Drive Shack Inc. retained a portion of the notes issued by, and all of the equity of, both entities. Drive Shack Inc., as holder of the equity (or residual interest), had the option (a call option) to redeem the notes once
DRIVE SHACK INC. AND SUBSIDIARIES
NOTES TO CONSOLIDATED FINANCIAL STATEMENTS
DECEMBER 31, 2016, 2015 and 2014
(dollars in tables in thousands, except per share data)
the aggregate principal balance of Subprime Portfolio I or Subprime Portfolio II is equal to or less than 20% or 10%, respectively, of such balance at the date of the transfer. The transactions between Drive Shack Inc. and each securitization trust qualified as sales for accounting purposes. However, the loans subject to a call option were not treated as being sold and were classified as “held for investment” subsequent to the completion of the securitizations. The loans subject to call option and the corresponding financing recognize interest income and expense based on the expected weighted average coupons of the loans subject to call options at the call date of 9.24% and 8.68% for Subprime Portfolios I and II, respectively.
In both transactions, the residual interests and the retained bonds were reported as real estate securities, available for sale. The retained loans subject to call option and corresponding financing were reported as separate line items on Drive Shack Inc.’s Consolidated Balance Sheet.
On December 29, 2016, Drive Shack Inc. sold the call option to a third party for less than $0.1 million and recognized a gain of less than $0.1 million in other income on the Consolidated Statements of Operations. As a result of this sale, the loans subject to call option and corresponding financing were no longer reported on Drive Shack Inc.’s Consolidated Balance Sheet. Drive Shack Inc.’s exposure to loss is solely limited to the carrying amount of its residual interests and retained bonds which are issued by Subprime Portfolio I and Subprime Portfolio II.
Drive Shack Inc. received negligible cash flows from the retained interests of Subprime Portfolios I and II during the years ended December 31, 2016, 2015 and 2014.
DRIVE SHACK INC. AND SUBSIDIARIES
NOTES TO CONSOLIDATED FINANCIAL STATEMENTS
DECEMBER 31, 2016, 2015 and 2014
(dollars in tables in thousands, except per share data)
7. INVESTMENTS IN REAL ESTATE, NET OF ACCUMULATED DEPRECIATION
The following table summarizes the balances of real estate assets in the Traditional and Entertainment Golf businesses at December 31, 2016.
|
| | | | | | | | | | | | | | | | | | | | | | | | | | | | | | | | | | | | | | | | | | | | | | | | | | | | | | |
| | | | | | | | Initial Cost | | | | Gross Carrying Amount (A) (C) | | | | |
| | | | | | Date of Acquisition | | Land | | Buildings and Improvements | | Furniture, Fixtures and Equipment | | Construction-In-Progress | | Costs Capitalized Subsequent to Acquisition | | Land | | Buildings and Improvements | | Furniture, Fixtures and Equipment | | Construction-In-Progress | | | | Accumulated Depreciation (A)(B) | | Net Book Value |
Property Name | | City | | State | | | | | | | | | | | | Total | | |
Owned Properties | | | | | | | | | | | | | | | | | | | | | | | | | | | | |
Bear Creek | | Woodinville | | WA | | 12/30/13 | | $ | 3,573 |
| | $ | 2,178 |
| | $ | 179 |
| | $ | 28 |
| | $ | 907 |
| | $ | 3,573 |
| | $ | 2,302 |
| | $ | 457 |
| | $ | 533 |
| | $ | 6,865 |
| | $ | (783 | ) | | $ | 6,082 |
|
Bradshaw Farm | | Woodstock | | GA | | 12/30/13 | | 773 |
| | 1,962 |
| | 92 |
| | — |
| | 656 |
| | 773 |
| | 2,131 |
| | 579 |
| | — |
| | 3,483 |
| | (813 | ) | | 2,670 |
|
Brookstone | | Acworth | | GA | | 12/30/13 | | 579 |
| | 2,448 |
| | 200 |
| | — |
| | 1,110 |
| | 579 |
| | 2,976 |
| | 675 |
| | 107 |
| | 4,337 |
| | (966 | ) | | 3,371 |
|
Canyon Oaks | | Chico | | CA | | 12/30/13 | | 1,545 |
| | 4,127 |
| | 205 |
| | 13 |
| | 189 |
| | 1,545 |
| | 4,162 |
| | 367 |
| | 5 |
| | 6,079 |
| | (1,322 | ) | | 4,757 |
|
Casta Del Sol | | Mission Viejo | | CA | | 12/30/13 | | 5,794 |
| | — |
| | — |
| | — |
| | 307 |
| | 5,794 |
| | 74 |
| | 218 |
| | 15 |
| | 6,101 |
| | (77 | ) | | 6,024 |
|
El Camino | | Oceanside | | CA | | 12/30/13 | | 4,635 |
| | 2,960 |
| | 158 |
| | 80 |
| | 950 |
| | 4,635 |
| | 3,806 |
| | 342 |
| | — |
| | 8,783 |
| | (961 | ) | | 7,822 |
|
Forrest Crossing | | Franklin | | TN | | 12/30/13 | | 3,187 |
| | 807 |
| | 76 |
| | 55 |
| | 336 |
| | 3,187 |
| | 850 |
| | 423 |
| | 1 |
| | 4,461 |
| | (377 | ) | | 4,084 |
|
Gettysvue | | Knoxville | | TN | | 12/30/13 | | 2,994 |
| | 1,428 |
| | 235 |
| | 181 |
| | 336 |
| | 2,994 |
| | 1,647 |
| | 533 |
| | — |
| | 5,174 |
| | (728 | ) | | 4,446 |
|
Lomas Santa Fe (Executive) | | Solana Beach | | CA | | 12/30/13 | | 3,766 |
| | — |
| | — |
| | — |
| | 158 |
| | 3,766 |
| | 102 |
| | 56 |
| | — |
| | 3,924 |
| | (29 | ) | | 3,895 |
|
Marbella | | SJ Capistrano | | CA | | 12/30/13 | | 5,794 |
| | 9,114 |
| | 410 |
| | — |
| | 4,657 |
| | 5,794 |
| | 11,586 |
| | 1,835 |
| | 760 |
| | 19,975 |
| | (2,931 | ) | | 17,044 |
|
Monterey | | Palm Desert | | CA | | 12/30/13 | | 5,698 |
| | 3,004 |
| | 202 |
| | 19 |
| | 1,094 |
| | 5,698 |
| | 3,471 |
| | 831 |
| | 17 |
| | 10,017 |
| | (1,266 | ) | | 8,751 |
|
Oakhurst | | Clayton | | CA | | 12/30/13 | | 1,449 |
| | 2,575 |
| | 428 |
| | 1,645 |
| | (1,100 | ) | | 1,449 |
| | 2,714 |
| | 818 |
| | 16 |
| | 4,997 |
| | (1,206 | ) | | 3,791 |
|
Oregon Golf Club | | West Linn | | OR | | 12/30/13 | | 4,828 |
| | 8,011 |
| | 416 |
| | 51 |
| | 681 |
| | 4,828 |
| | 8,187 |
| | 969 |
| | 3 |
| | 13,987 |
| | (2,393 | ) | | 11,594 |
|
Palm Valley | | Palm Desert | | CA | | 12/30/13 | | 7,531 |
| | 8,864 |
| | 379 |
| | 56 |
| | 770 |
| | 7,531 |
| | 8,822 |
| | 1,228 |
| | 19 |
| | 17,600 |
| | (2,603 | ) | | 14,997 |
|
Plantation | | Boise | | ID | | 12/30/13 | | 2,607 |
| | 2,236 |
| | 262 |
| | 13 |
| | 558 |
| | 2,607 |
| | 2,326 |
| | 742 |
| | 1 |
| | 5,676 |
| | (876 | ) | | 4,800 |
|
Rancho San Joaquin | | Irvine | | CA | | 12/30/13 | | 12,650 |
| | 3,775 |
| | 279 |
| | 1,366 |
| | 980 |
| | 12,650 |
| | 5,005 |
| | 1,116 |
| | 279 |
| | 19,050 |
| | (1,444 | ) | | 17,606 |
|
Seascape | | Aptos | | CA | | 12/30/13 | | 2,897 |
| | 4,944 |
| | 108 |
| | 67 |
| | 534 |
| | 2,897 |
| | 5,225 |
| | 420 |
| | 8 |
| | 8,550 |
| | (1,303 | ) | | 7,247 |
|
Summitpointe | | Milpitas | | CA | | 12/30/13 | | 2,511 |
| | 3,271 |
| | 128 |
| | 8 |
| | 820 |
| | 2,511 |
| | 3,580 |
| | 647 |
| | — |
| | 6,738 |
| | (1,069 | ) | | 5,669 |
|
Sunset Hills | | Thousand Oaks | | CA | | 12/30/13 | | 2,125 |
| | 5,447 |
| | 383 |
| | — |
| | 893 |
| | 2,125 |
| | 5,713 |
| | 1,010 |
| | — |
| | 8,848 |
| | (1,798 | ) | | 7,050 |
|
Tanoan | | Albuquerque | | NM | | 12/30/13 | | 1,642 |
| | 7,600 |
| | 431 |
| | 364 |
| | 478 |
| | 1,642 |
| | 8,031 |
| | 822 |
| | 20 |
| | 10,515 |
| | (2,684 | ) | | 7,831 |
|
Trophy Club of Apalachee | | Dacula | | GA | | 12/30/13 | | 483 |
| | 640 |
| | 55 |
| | — |
| | 885 |
| | 483 |
| | 1,046 |
| | 534 |
| | — |
| | 2,063 |
| | (351 | ) | | 1,712 |
|
DRIVE SHACK INC. AND SUBSIDIARIES
NOTES TO CONSOLIDATED FINANCIAL STATEMENTS
DECEMBER 31, 2016, 2015 and 2014
(dollars in tables in thousands, except per share data)
|
| | | | | | | | | | | | | | | | | | | | | | | | | | | | | | | | | | | | | | | | | | | | | | | | | | | | | | |
| | | | | | | | Initial Cost | | | | Gross Carrying Amount (A) (C) | | | | |
| | | | | | Date of Acquisition | | Land | | Buildings and Improvements | | Furniture, Fixtures and Equipment | | Construction-In-Progress | | Costs Capitalized Subsequent to Acquisition | | Land | | Buildings and Improvements | | Furniture, Fixtures and Equipment | | Construction-In-Progress | | | | Accumulated Depreciation (A)(B) | | Net Book Value |
Property Name | | City | | State | | | | | | | | | | | | Total | | |
Trophy Club of Atlanta | | Alpharetta | | GA | | 12/30/13 | | 483 |
| | 3,898 |
| | 60 |
| | — |
| | 519 |
| | 483 |
| | 4,148 |
| | 327 |
| | 2 |
| | 4,960 |
| | (994 | ) | | 3,966 |
|
Vista Valencia | | Valencia | | CA | | 12/30/13 | | 1,352 |
| | 5,199 |
| | 91 |
| | — |
| | 479 |
| | 1,352 |
| | 5,441 |
| | 323 |
| | 5 |
| | 7,121 |
| | (1,402 | ) | | 5,719 |
|
Wood Ranch | | Simi Valley | | CA | | 12/30/13 | | 2,125 |
| | 1,951 |
| | 239 |
| | 416 |
| | 903 |
| | 2,125 |
| | 2,339 |
| | 1,041 |
| | 129 |
| | 5,634 |
| | (1,074 | ) | | 4,560 |
|
Other | | N/A | | N/A | | 12/30/13 | | 3,960 |
| | — |
| | — |
| | — |
| | (128 | ) | | 3,298 |
| | 238 |
| | 285 |
| | 11 |
| | 3,832 |
| | (100 | ) | | 3,732 |
|
Total Owned Properties | | | | | | $ | 84,981 |
| | $ | 86,439 |
| | $ | 5,016 |
| | $ | 4,362 |
| | $ | 17,972 |
| | $ | 84,319 |
| | $ | 95,922 |
| | $ | 16,598 |
| | $ | 1,931 |
| | $ | 198,770 |
| | $ | (29,550 | ) | | $ | 169,220 |
|
|
| | | | | | | | | | | | | | | | | | | | | | | | | | | | | | | | | | | | | | | | | | | | | | | | | | | | | | |
Managed Properties | | | | | | | | | | | | | | | | | | | | | | | | | | | | |
El Cariso | | Sylmar | | CA | | 12/30/13 | | — |
| | — |
| | — |
| | — |
| | 32 |
| | — |
| | — |
| | 32 |
| | — |
| | 32 |
| | (6 | ) | | 26 |
|
Fullerton | | Fullerton | | CA | | 12/30/13 | | — |
| | — |
| | — |
| | — |
| | 373 |
| | — |
| | — |
| | 373 |
| | — |
| | 373 |
| | (103 | ) | | 270 |
|
John A White | | Atlanta | | GA | | 12/30/13 | | — |
| | — |
| | — |
| | — |
| | — |
| | — |
| | — |
| | — |
| | — |
| | — |
| | — |
| | — |
|
Lomas Santa Fe | | Solana Beach | | CA | | 12/30/13 | | — |
| | — |
| | 8 |
| | — |
| | 500 |
| | — |
| | — |
| | 508 |
| | — |
| | 508 |
| | (93 | ) | | 415 |
|
Paradise Knolls | | Riverside | | CA | | 12/30/13 | | — |
| | — |
| | 46 |
| | — |
| | — |
| | — |
| | — |
| | 46 |
| | — |
| | 46 |
| | (46 | ) | | — |
|
Santa Clara | | Santa Clara | | CA | | 12/30/13 | | — |
| | — |
| | — |
| | — |
| | — |
| | — |
| | — |
| | — |
| | — |
| | — |
| | — |
| | — |
|
Tustin Ranch | | Tustin | | CA | | 10/01/16 | | — |
| | — |
| | — |
| | — |
| | — |
| | — |
| | — |
| | — |
| | — |
| | — |
| | — |
| | — |
|
Westchester | | Los Angeles | | CA | | 12/30/13 | | — |
| | — |
| | — |
| | — |
| | 53 |
| | — |
| | — |
| | 53 |
| | — |
| | 53 |
| | (10 | ) | | 43 |
|
Woodlands | | Wayne | | MI | | 12/30/13 | | — |
| | — |
| | — |
| | — |
| | 8 |
| | — |
| | — |
| | 8 |
| | — |
| | 8 |
| | (2 | ) | | 6 |
|
Yorba Linda | | Yorba Linda | | CA | | 12/30/13 | | — |
| | — |
| | 5 |
| | — |
| | 673 |
| | — |
| | — |
| | 678 |
| | — |
| | 678 |
| | (64 | ) | | 614 |
|
Total Managed Properties | | | | | | $ | — |
| | $ | — |
| | $ | 59 |
| | $ | — |
| | $ | 1,639 |
| | $ | — |
| | $ | — |
| | $ | 1,698 |
| | $ | — |
| | $ | 1,698 |
| | $ | (324 | ) | | $ | 1,374 |
|
| | | | | | | | | | | | | | | | | | | | | | | | | | | | | | |
Total Leased Properties (D) | | | | | | — |
| | 46,067 |
| | 8,067 |
| | 1,228 |
| | 20,119 |
| | — |
| | 48,768 |
| | 25,976 |
| | 737 |
| | 75,481 |
| | (29,823 | ) | | 45,658 |
|
| | | | | | | | | | | | | | | | | | | | | | | | | | | | | | |
Corporate | | N/A | | N/A | | | | — |
| | — |
| | 3,219 |
| | — |
| | 3,179 |
| | — |
| | — |
| | 5,704 |
| | 694 |
| | 6,398 |
| | (5,039 | ) | | 1,359 |
|
| | | | | | | | | | | | | | | | | | | | | | | | | | | | | | |
Total Properties | | | | | | $ | 84,981 |
| | $ | 132,506 |
| | $ | 16,361 |
| | $ | 5,590 |
| | $ | 42,909 |
| | $ | 84,319 |
| | $ | 144,690 |
| | $ | 49,976 |
| | $ | 3,362 |
| | $ | 282,347 |
| | $ | (64,736 | ) | | $ | 217,611 |
|
| | | | | | | | | | | | | | | | | | | | | | | | | | | | | | |
DRIVE SHACK INC. AND SUBSIDIARIES
NOTES TO CONSOLIDATED FINANCIAL STATEMENTS
DECEMBER 31, 2016, 2015 and 2014
(dollars in tables in thousands, except per share data)
| |
(A) | The following is a rollforward of the gross carrying amount and accumulated depreciation of real estate for the years ended December 31, 2016, 2015 and 2014. |
|
| | | | | | | | | | | |
| Year ended December 31, |
| 2016 | | 2015 | | 2014 |
Gross Carrying Amount | | | | | |
Balance at beginning of year | $ | 276,119 |
| | $ | 263,103 |
| | $ | 250,208 |
|
Additions: | | | | | |
Acquisitions of real estate | — |
| | — |
| | — |
|
Improvements | 20,982 |
| | 14,970 |
| | 15,109 |
|
Disposals: | | | | | |
Disposal of long-lived assets | (5,500 | ) | | (1,954 | ) | | (2,214 | ) |
Impairments (E) | (7,196 | ) | | — |
| | — |
|
Transferred to assets held-for-sale (F) | (2,058 | ) | | — |
| | — |
|
Balance at end of year | $ | 282,347 |
| | $ | 276,119 |
| | $ | 263,103 |
|
| | | | | |
Accumulated Depreciation | | | | | |
Balance at beginning of year | $ | (48,212 | ) | | $ | (23,820 | ) | | $ | — |
|
Additions: | | | | | |
Depreciation expense | (23,351 | ) | | (24,943 | ) | | (24,740 | ) |
Disposals: | | | | | |
Disposal of long-lived assets | 5,319 |
| | 551 |
| | 920 |
|
Impairments | 1,443 |
| | — |
| | — |
|
Transferred to assets held-for-sale | 65 |
| | — |
| | — |
|
Balance at end of year | $ | (64,736 | ) | | $ | (48,212 | ) | | $ | (23,820 | ) |
| |
(B) | Depreciation is calculated on a straight line basis using the estimated useful lives detailed in Note 2. |
| |
(C) | The aggregate United States federal income tax basis for Drive Shack Inc.’s operating real estate, including furniture, fixtures and equipment at December 31, 2016 was approximately $337.8 million. |
| |
(D) | Total leased properties includes $0.7 million of construction-in-progress for Entertainment Golf. |
| |
(E) | Impairments include a property in Annandale, New Jersey, a property in Gresham, Oregon and a property in San Leandro, California. |
| |
(F) | Includes one owned property in Annandale, New Jersey in the Traditional Golf segment classified as held-for-sale as of December 31, 2016. Assets held-for-sale are recorded in receivables and other assets in the Consolidated Balance Sheets. See Note 2 for additional information. |
The real estate assets in Traditional Golf are encumbered by various debt obligations, as described in Note 11, at December 31, 2016.
In January 2016, the lease on a golf property in Oregon expired and we did not renew the lease for such property. In July 2016, the lease on a golf property in California was terminated and we exited the property. In October 2016, the leases of golf properties in Georgia and California expired and we exited the properties. In October 2016, we entered into a management agreement for an 18-hole golf property in Tustin, California. The management agreement is for a term of 4.5 years. In December 2016, the lease on a golf property in Oklahoma expired and we exited the property.
DRIVE SHACK INC. AND SUBSIDIARIES
NOTES TO CONSOLIDATED FINANCIAL STATEMENTS
DECEMBER 31, 2016, 2015 and 2014
(dollars in tables in thousands, except per share data)
8. INTANGIBLES, NET OF ACCUMULATED AMORTIZATION
The following table summarizes Drive Shack Inc.'s intangibles related to Traditional Golf:
|
| | | | | | | | | | | | | | | | | | | | | | | |
| December 31, 2016 | | December 31, 2015 |
| Gross Carrying Amount | | Accumulated Amortization | | Net Carrying Value | | Gross Carrying Amount | | Accumulated Amortization | | Net Carrying Value |
Trade name | $ | 700 |
| | $ | (70 | ) | | $ | 630 |
| | $ | 700 |
| | $ | (47 | ) | | $ | 653 |
|
Leasehold intangibles (A) | 48,107 |
| | (12,550 | ) | | 35,557 |
| | 49,962 |
| | (9,817 | ) | | 40,145 |
|
Management contracts | 35,207 |
| | (10,434 | ) | | 24,773 |
| | 36,500 |
| | (7,911 | ) | | 28,589 |
|
Internally-developed software | 800 |
| | (480 | ) | | 320 |
| | 800 |
| | (320 | ) | | 480 |
|
Membership base | 5,236 |
| | (2,244 | ) | | 2,992 |
| | 5,236 |
| | (1,496 | ) | | 3,740 |
|
Nonamortizable liquor licenses | 840 |
| | — |
| | 840 |
| | 865 |
| | — |
| | 865 |
|
Total intangibles | $ | 90,890 |
| | $ | (25,778 | ) | | $ | 65,112 |
| | $ | 94,063 |
| | $ | (19,591 | ) | | $ | 74,472 |
|
| |
(A) | The amortization expense for leasehold intangibles is reported in operating expenses in the Consolidated Statements of Operations. |
Amortization expense for the years ended December 31, 2016, 2015, and 2014 was $8.9 million, $10.0 million and $10.8 million, respectively.
The unamortized balance of intangible assets at December 31, 2016 is expected to be amortized as follows:
|
| | | |
2017 | $ | 8,244 |
|
2018 | 8,066 |
|
2019 | 7,258 |
|
2020 | 6,714 |
|
2021 | 4,920 |
|
Thereafter | 29,070 |
|
| $ | 64,272 |
|
9. DERIVATIVES
Drive Shack Inc.'s derivative instruments are comprised of interest rate swaps, interest rate caps and TBAs. Derivative assets with a fair value of $0.9 million and $0.1 million as of December 31, 2016 and 2015, respectively, were recorded within receivables and other assets on the Consolidated Balance Sheets. Derivative liabilities with a fair value of zero and $0.7 million as of December 31, 2016 and 2015, respectively, were recorded within accounts payable, accrued expenses and other liabilities on the Consolidated Balance Sheets.
DRIVE SHACK INC. AND SUBSIDIARIES
NOTES TO CONSOLIDATED FINANCIAL STATEMENTS
DECEMBER 31, 2016, 2015 and 2014
(dollars in tables in thousands, except per share data)
The following table summarizes (gains) losses recorded in relation to derivatives:
|
| | | | | | | | | | | | | |
| Income Statement Location | | Year Ended December 31, |
Cash flow hedges | | | 2016 | | 2015 | | 2014 |
Loss immediately recognized at de-designation | Realized/unrealized (gain) loss on investments | | $ | — |
| | $ | — |
| | $ | 34 |
|
Loss recognized on termination of derivative instruments | Realized/unrealized (gain) loss on investments | | — |
| | 612 |
| | — |
|
Deferred hedge gain reclassified from AOCI into earnings | Interest expense | | (20 | ) | | (78 | ) | | (61 | ) |
Amount of loss reclassified from AOCI into income (effective portion) | Interest expense | | — |
| | 1,363 |
| | 4,379 |
|
Amount of unrealized loss recognized in Other Comprehensive Income on derivatives (effective portion) | N/A | | — |
| | 60 |
| | 177 |
|
| | | | | | | |
Non-hedge derivatives | | | | | | | |
Unrealized gain on interest rate derivatives | Realized/unrealized (gain) loss on investments | | $ | (294 | ) | | $ | (284 | ) | | $ | (7,131 | ) |
Gain recognized related to linked transactions | Realized/unrealized (gain) loss on investments | | — |
| | — |
| | (12,498 | ) |
Loss recognized related to linked transactions | Interest expense | | — |
| | — |
| | 211 |
|
Unrealized (gain) loss recognized related to TBAs | Realized/unrealized (gain) loss on investments | | (928 | ) | | (1,474 | ) | | 2,030 |
|
Realized (gain) loss on settlement of TBAs | Realized/unrealized (gain) loss on investments | | (18,318 | ) | | 12,907 |
| | 4,151 |
|
As of December 31, 2016 and 2015, Drive Shack Inc. had zero and less than $0.1 million, respectively, of expected reclassification of deferred hedges from AOCI into earnings over the next 12 months.
DRIVE SHACK INC. AND SUBSIDIARIES
NOTES TO CONSOLIDATED FINANCIAL STATEMENTS
DECEMBER 31, 2016, 2015 and 2014
(dollars in tables in thousands, except per share data)
10. FAIR VALUE OF FINANCIAL INSTRUMENTS
The following table summarizes the carrying values and estimated fair values of Drive Shack Inc.’s financial instruments at December 31, 2016 and 2015:
|
| | | | | | | | | | | | | | | | | |
| December 31, 2016 | December 31, 2015 |
| Carrying
Value | | Estimated
Fair Value | | Fair Value Method (A) | | Carrying
Value | | Estimated
Fair Value |
Assets | | | | | | | | | |
Real estate securities, available-for-sale | $ | 1,950 |
| | $ | 1,950 |
| | Broker/counterparty quotations, pricing services, pricing models | | $ | 59,034 |
| | $ | 59,034 |
|
Real estate securities, pledged as collateral | 627,304 |
| | 627,304 |
| | Broker/counterparty quotations, pricing services | | 105,963 |
| | 105,963 |
|
Real estate related and other loans, held-for-sale, net | 55,612 |
| | 61,144 |
| | Pricing models, broker/counterparty quotations, pricing services | | 149,198 |
| | 165,270 |
|
Residential mortgage loans, held-for-sale, net (B) | 231 |
| | 249 |
| | Broker/counterparty quotations, pricing models | | 532 |
| | 569 |
|
Subprime mortgage loans subject to call option (C) | — |
| | — |
| | (C) | | 380,806 |
| | 380,806 |
|
Restricted cash | 6,404 |
| | 6,404 |
| | | | 4,469 |
| | 4,469 |
|
Cash and cash equivalents | 140,140 |
| | 140,140 |
| | | | 45,651 |
| | 45,651 |
|
Non-hedge derivative assets (D) | 856 |
| | 856 |
| | Counterparty quotations, pricing services | | 127 |
| | 127 |
|
| | | | | | | | | |
Liabilities | | | | | | | | | |
CDO bonds payable (E) | $ | — |
| | $ | — |
| | Pricing models | | $ | 92,933 |
| | $ | 15,193 |
|
Other bonds and notes payable (E) | — |
| | — |
| | Pricing models | | 16,162 |
| | 16,620 |
|
Repurchase agreements | 600,964 |
| | 600,964 |
| | Counterparty quotations, market comparables | | 418,458 |
| | 418,625 |
|
Credit facilities and obligations under capital leases | 115,284 |
| | 115,284 |
| | Pricing models | | 11,258 |
| | 11,258 |
|
Financing of subprime mortgage loans subject to call option (C) | — |
| | — |
| | (C) | | 380,806 |
| | 380,806 |
|
Junior subordinated notes payable | 51,217 |
| | 26,756 |
| | Pricing models | | 51,225 |
| | 24,649 |
|
Non-hedge derivative liabilities (D) | — |
| | — |
| | Counterparty quotations, pricing services | | 684 |
| | 684 |
|
| |
(A) | Methods are listed in order of priority. In the case of real estate securities and real estate related and other loans, broker quotations are obtained if available and practicable, otherwise counterparty quotations or pricing service valuations are obtained or, finally, internal pricing models are used. Internal pricing models are only used for (i) securities and loans that are not traded in an active market, and, therefore, have little or no price transparency, and for which significant unobservable inputs must be used in estimating fair value, or (ii) loans or debt obligations which are private and untraded. |
| |
(B) | Residential mortgage loans held-for-sale, net is recorded in receivables and other assets on the Consolidated Balance Sheets. |
| |
(C) | Represents an option, not an obligation, to repurchase loans from Drive Shack Inc.’s subprime mortgage loan securitizations (Note 6). |
| |
(D) | Represents derivative assets and liabilities including interest rate swaps and TBA forward contracts (Note 9). |
| |
(E) | Drive Shack Inc. notes that the unrealized gain on the liabilities within such structures cannot be fully realized. Assets held within CDOs and other non- recourse structures are generally not available to satisfy obligations outside of such financings, except to the extent Drive Shack Inc. receives net cash flow distributions from such structures. Furthermore, creditors or beneficial interest holders of these structures have no recourse to the general credit of Drive Shack Inc. Therefore, Drive Shack Inc.’s exposure to the economic losses from such structures is limited to its invested equity in them and economically their book value cannot be less than zero. As a result, the fair value of Drive Shack Inc.’s net investments in these non-recourse financing structures is equal to the present value of their expected future net cash flows. |
Fair Value Measurements
Valuation Hierarchy
The fair value of financial instruments is categorized based on the priority of the inputs to the valuation technique and categorized into a three-level fair value hierarchy. The fair value hierarchy gives the highest priority to quoted prices in active markets for identical assets or liabilities (Level 1) and the lowest priority to unobservable inputs (Level 3). Drive Shack Inc. follows this hierarchy for its financial instruments measured at fair value.
Level 1 - Quoted prices in active markets for identical instruments.
Level 2 - Valuations based principally on observable market parameters, including:
•quoted prices for similar assets and liabilities in active markets,
| |
• | inputs other than quoted prices that are observable for the asset or liability (such as interest rates and yield curves observable at commonly quoted intervals, implied volatilities and credit spreads), and |
•market corroborated inputs (derived principally from or corroborated by observable market data).
DRIVE SHACK INC. AND SUBSIDIARIES
NOTES TO CONSOLIDATED FINANCIAL STATEMENTS
DECEMBER 31, 2016, 2015 and 2014
(dollars in tables in thousands, except per share data)
Level 3 - Valuations determined using unobservable inputs that are supported by little or no market activity, and that are significant to the overall fair value measurement. Level 3 assets and liabilities include financial instruments whose value is determined using non-binding market quotations, pricing models, discounted cash flow methodologies, or similar techniques where significant inputs are unobservable, as well as instruments for which the determination of fair value requires significant management judgment or estimation.
Fair value may be based upon broker quotations, counterparty quotations or pricing services quotations, which provide valuation estimates based upon reasonable market order indications or management's good faith estimate, and are subject to significant variability based on market conditions, such as interest rates, credit spreads and market liquidity. A significant portion of Drive Shack Inc.’s loans, securities and debt obligations are currently not traded in active markets and therefore have little or no price transparency. As a result, Drive Shack Inc. has estimated the fair value of these illiquid instruments based on internal pricing models or quotations subject to Drive Shack Inc.'s controls described below.
Drive Shack Inc. has various processes and controls in place to ensure that fair value measurements are reasonably estimated. With respect to broker and pricing service quotations, and in order to ensure these quotes represent a reasonable estimate of fair value, Drive Shack Inc.’s quarterly procedures include a comparison of such quotations to quotations from different sources, outputs generated from its internal pricing models and transactions completed, as well as on its knowledge and experience of these markets. With respect to fair value estimates generated based on Drive Shack Inc.’s internal pricing models, Drive Shack Inc.’s management validates the inputs and outputs of the internal pricing models by comparing them to available independent third party market parameters and models, where available, for reasonableness. Drive Shack Inc. believes its valuation methods and the assumptions used are appropriate and consistent with other market participants.
Fair value measurements categorized within Level 3 are sensitive to changes in the assumptions or methodology used to determine fair value and such changes could result in a significant increase or decrease in the fair value. For Drive Shack Inc.’s investments in real estate securities, real estate related and other loans and residential mortgage loans categorized within Level 3 of the fair value hierarchy, the significant unobservable inputs include the discount rates, assumptions relating to prepayments, default rates and loss severities. Significant increases (decreases) in any of the discount rates, default rates or loss severities in isolation would result in a significantly lower (higher) fair value measurement. The impact of changes in prepayment speeds would have differing impacts on fair value, depending on the seniority of the investment. Generally, a change in the default assumption is accompanied by directionally similar changes in the assumptions used for the loss severity and the prepayment speed.
DRIVE SHACK INC. AND SUBSIDIARIES
NOTES TO CONSOLIDATED FINANCIAL STATEMENTS
DECEMBER 31, 2016, 2015 and 2014
(dollars in tables in thousands, except per share data)
Recurring Fair Value Measurements - Real Estate Securities and Derivatives
The following table summarizes financial assets and liabilities measured at fair value on a recurring basis at December 31, 2016:
|
| | | | | | | | | | | | | | | | | | | |
| | | Fair Value |
| Carrying Value | | Level 2 | | Level 3 | | Total |
| | | Market Quotations
(Observable) | | Market Quotations (Unobservable) | | Internal Pricing Models | | |
Assets: | | | | | | | | | |
Real estate securities, available for sale: | | | | | | | | | |
ABS- Non-Agency RMBS | $ | 1,950 |
| | $ | — |
| | $ | — |
| | $ | 1,950 |
| | $ | 1,950 |
|
Real estate securities, available for sale total | $ | 1,950 |
| | $ | — |
| | $ | — |
| | $ | 1,950 |
| | $ | 1,950 |
|
| | | | | | | | | |
Real estate securities, pledged as collateral: | | | | | | | | | |
FNMA/FHLMC | $ | 627,304 |
| | $ | 627,304 |
| | $ | — |
| | $ | — |
| | $ | 627,304 |
|
Real estate securities, pledged as collateral | $ | 627,304 |
| | $ | 627,304 |
| | $ | — |
| | $ | — |
| | $ | 627,304 |
|
| | | | | | | | | |
Derivative assets: | | | | | | | | | |
Interest rate cap, not treated as hedge | $ | 371 |
| | $ | 371 |
| | $ | — |
| | $ | — |
| | $ | 371 |
|
TBAs, not treated as hedges | 485 |
| | 485 |
| | — |
| | — |
| | 485 |
|
Derivative assets total | $ | 856 |
| | $ | 856 |
| | $ | — |
| | $ | — |
| | $ | 856 |
|
Significant Unobservable Inputs
The following table provides quantitative information regarding the significant unobservable inputs used by Drive Shack Inc. for assets and liabilities measured at fair value on a recurring basis as of December 31, 2016. This table excludes inputs used to measure fair value that are not developed by Drive Shack Inc., such as broker prices and other third-party pricing service valuations.
|
| | | | | | | | | | | | | | | | | | | | |
| | | | | | Weighted Average Significant Input |
Asset Type | | Amortized
Cost
Basis | | Fair
Value | | Discount Rate | | Prepayment Speed | | Cumulative Default Rate | | Loss Severity |
ABS - Non-Agency RMBS | | $ | 782 |
| | $ | 1,950 |
| | 12.0 | % | | 3.9 | % | | 5.1 | % | | 64.2 | % |
Total | | $ | 782 |
| | $ | 1,950 |
| | | | | | | | |
All of the inputs used have some degree of market observability, based on Drive Shack Inc.’s knowledge of the market, relationships with market participants, and use of common market data sources. Collateral prepayment, default and loss severity projections are in the form of “curves” or “vectors” that vary for each monthly collateral cash flow projection. Methods used to develop these projections vary by asset class (e.g., CMBS projections are developed differently than home equity ABS projections) but conform to industry conventions. Drive Shack Inc. uses assumptions that generate its best estimate of future cash flows of each respective security.
The prepayment speed vector specifies the percentage of the collateral balance that is expected to voluntarily pay off at each point in the future. The prepayment speed vector is based on projections from a widely published investment bank model, which considers factors such as collateral FICO score, loan-to-value ratio, debt-to-income ratio, and vintage on a loan level basis. This vector is scaled up or down to match recent collateral-specific prepayment experience, as obtained from remittance reports and market data services.
DRIVE SHACK INC. AND SUBSIDIARIES
NOTES TO CONSOLIDATED FINANCIAL STATEMENTS
DECEMBER 31, 2016, 2015 and 2014
(dollars in tables in thousands, except per share data)
Loss severities are based on recent collateral-specific experience with additional consideration given to collateral characteristics. Collateral age is taken into consideration because severities tend to initially increase with collateral age before eventually stabilizing. Drive Shack Inc. typically uses projected severities that are higher than the historic experience for collateral that is relatively new to account for this effect. Collateral characteristics such as loan size, lien position, and location (state) also affect loss severity. Drive Shack Inc. considers whether a collateral pool has experienced a significant change in its composition with respect to these factors when assigning severity projections.
Default rates are determined from the current “pipeline” of loans that are more than 90 days delinquent, in foreclosure, or are REO. These significantly delinquent loans determine the first 24 months of the default vector. Beyond month 24, the cumulative default vector transitions to a steady-state value that is generally equal to or greater than that given by the widely published investment bank model.
The discount rates Drive Shack Inc. uses are derived from a range of observable pricing on securities backed by similar collateral and offered in a live market. As the markets in which Drive Shack Inc. transacts have become less liquid, Drive Shack Inc. has had to rely on fewer data points in this analysis.
Drive Shack Inc.’s investments in instruments measured at fair value on a recurring basis using Level 3 inputs changed as follows:
|
| | | | | | | | | | | | | | | |
| Level 3 Assets |
| CMBS | | ABS - Non-Agency RMBS | | Equity/Other Securities | | Total |
| | | | | | | |
Balance at December 31, 2014 | $ | 178,763 |
| | $ | 45,035 |
| | $ | 7,956 |
| | $ | 231,754 |
|
Transfers | | | | | | | |
Transfer into Level 3 | — |
| | — |
| | 367 |
| | 367 |
|
Total gains (losses) (A) | | | | | | | |
Included in net income (B) | 12,038 |
| | 14,826 |
| | (367 | ) | | 26,497 |
|
Included in other comprehensive income (loss) | (18,797 | ) | | (12,933 | ) | | 1,775 |
| | (29,955 | ) |
Amortization included in interest income | 6,866 |
| | 2,849 |
| | — |
| | 9,715 |
|
Purchases, sales and settlements | | | | | | | |
Purchases | — |
| | — |
| | — |
| | — |
|
Proceeds from sales | (102,607 | ) | | (37,582 | ) | | — |
| | (140,189 | ) |
Proceeds from repayments | (36,579 | ) | | (2,576 | ) | | — |
| | (39,155 | ) |
Balance at December 31, 2015 | $ | 39,684 |
| | $ | 9,619 |
| | $ | 9,731 |
| | $ | 59,034 |
|
CDO VI deconsolidation | (37,179 | ) | | (6,710 | ) | | — |
| | (43,889 | ) |
Total gains (losses) (A) | | | | | | | |
Included in net income (B) | (108 | ) | | 3 |
| | 11,232 |
| | 11,127 |
|
Included in other comprehensive income (loss) | (658 | ) | | (1,015 | ) | | (9,731 | ) | | (11,404 | ) |
Amortization included in interest income | 879 |
| | 278 |
| | — |
| | 1,157 |
|
Purchases, sales and settlements | | | | | | | |
Purchases | — |
| | — |
| | — |
| | — |
|
Proceeds from sales | (2 | ) | | (3 | ) | | (11,232 | ) | | (11,237 | ) |
Proceeds from repayments | (2,616 | ) | | (222 | ) | | — |
| | (2,838 | ) |
Balance at December 31, 2016 | $ | — |
| | $ | 1,950 |
| | $ | — |
| | $ | 1,950 |
|
| |
(A) | None of the gains (losses) recorded in earnings during the periods is attributable to the change in unrealized gains (losses) relating to Level 3 assets still held at the reporting dates. |
| |
(B) | These gains (losses) are recorded in the following line items in the Consolidated Statements of Operations: |
DRIVE SHACK INC. AND SUBSIDIARIES
NOTES TO CONSOLIDATED FINANCIAL STATEMENTS
DECEMBER 31, 2016, 2015 and 2014
(dollars in tables in thousands, except per share data)
|
| | | | | | | |
| Year Ended December 31, |
| 2016 | | 2015 |
Realized/unrealized gain on investments | $ | 11,237 |
| | $ | 28,854 |
|
Impairment (reversal) | (110 | ) | | (2,357 | ) |
Total | $ | 11,127 |
| | $ | 26,497 |
|
Realized/unrealized gain on investments, net, from investments transferred into Level 3 during the period | $ | — |
| | $ | — |
|
Non Recurring Fair Value Measurements - Loans
Loans which Drive Shack Inc. does not have the ability or intent to hold into the foreseeable future are classified as held-for-sale. Held-for-sale loans are carried at the lower of amortized cost or fair value and are therefore recorded at fair value on a non-recurring basis. These loans were written down to fair value at the time of the impairment, based on broker quotations, pricing service quotations or internal pricing models. All the loans were within Level 3 of the fair value hierarchy. For real estate related and other loans, the most significant inputs used in the valuations are the amount and timing of expected future cash flows, market yields and the estimated collateral value of such loan investments.
The following tables summarize certain information for real estate related and other loans as of December 31, 2016:
|
| | | | | | | | | | | | | | | | | | |
| | | | | | Significant Input |
| | | | | | Range | | Weighted Average |
Loan Type | | Carrying Value | | Fair Value | | Discount Rate | | Loss Severity | | Discount Rate | | Loss Severity |
Corporate Loans | | $ | 55,612 |
| | $ | 61,144 |
| | 0.0% - 22.5% | | 0.0% - 100.0% | | 22.5 | % | | 49.3 | % |
Total Real Estate Related and Other Loans Held for Sale, Net (A) | | $ | 55,612 |
| | $ | 61,144 |
| | | | | | | | |
| |
(A) | Excludes $17.8 million face amount of mezzanine loans which have a zero carrying value. |
DRIVE SHACK INC. AND SUBSIDIARIES
NOTES TO CONSOLIDATED FINANCIAL STATEMENTS
DECEMBER 31, 2016, 2015 and 2014
(dollars in tables in thousands, except per share data)
Liabilities for Which Fair Value is Only Disclosed
The following table summarizes the level of the fair value hierarchy, valuation techniques and inputs used for estimating each class of liabilities not measured at fair value in the statement of financial position but for which fair value is disclosed:
|
| | | | | |
Type of Liabilities | | | | |
Not Measured At Fair | | | | |
Value for Which | | | | |
Fair Value Is Disclosed | | Fair Value Hierarchy | | Valuation Techniques and Significant Inputs |
| | | | |
Repurchase agreements | | Level 2 | | Valuation technique is based on market comparables. Significant variables include: |
| | | | • | Amount and timing of expected future cash flows |
| | | | • | Interest rates |
| | | | • | Collateral funding spreads |
| | | | | |
Golf credit facilities | | Level 3 | | Valuation technique is based on discounted cash flows. Significant inputs include: |
| | | | • | Amount and timing of expected future cash flows |
| | | | • | Interest rates |
| | | | • | Market yields |
| | | | | |
Junior subordinated notes payable | | Level 3 | | Valuation technique is based on discounted cash flows. Significant inputs include: |
| | | | • | Amount and timing of expected future cash flows |
| | | | • | Interest rates |
| | | | • | Market yields and the credit spread of Drive Shack Inc. |
DRIVE SHACK INC. AND SUBSIDIARIES
NOTES TO CONSOLIDATED FINANCIAL STATEMENTS
DECEMBER 31, 2016, 2015 and 2014
(dollars in tables in thousands, except per share data)
11. DEBT OBLIGATIONS
The following table presents certain information regarding Drive Shack Inc.'s debt obligations and related hedges:
|
| | | | | | | | | | | | | | | | | | | | | | | | | | | | | | |
| December 31, 2016 | December 31, 2015 |
| | | | | | | | | | | | | | | | | | | |
Debt Obligation/Collateral | Month Issued | | Outstanding Face Amount | | Carrying Value | | Final Stated Maturity | | Weighted Average Coupon (A) | | Weighted Average Funding Cost (B) | | Weighted Average Life (Years) | | Face Amount of Floating Rate Debt | | Outstanding Face Amount | | Carrying Value |
CDO Bonds Payable | | | | | | | | | | | | | | | | | | | |
CDO VI | Apr 2005 | | $ | — |
| | $ | — |
| | — | | —% | | — | % | | 0.0 | | $ | — |
| | $ | 92,933 |
| | $ | 92,933 |
|
| | | — |
| | — |
| | | | | | — | % | | 0.0 | | — |
| | 92,933 |
| | 92,933 |
|
Other Bonds & Notes Payable | | | | | | | | | | | | | | | | | | | |
NCT 2013-VI IMM-1 | Nov 2013 | | — |
| | — |
| | — | | —% | | — | % | | 0.0 | | — |
| | 4,984 |
| | 4,672 |
|
Mezzanine Note Payable | Oct 2015 | | — |
| | — |
| | — | | —% | | — | % | | 0.0 | | — |
| | 11,660 |
| | 11,490 |
|
| | | — |
| | — |
| | | | | | — | % | | 0.0 | | — |
| | 16,644 |
| | 16,162 |
|
Repurchase Agreements (C) | | | | | | | | | | | | | | | | | | | |
FNMA/FHLMC securities | Dec 2016 | | 600,964 |
| | 600,964 |
| | Jan 2017 | | 1.03% | | 1.03 | % | | 0.1 | | — |
| | 348,625 |
| | 348,625 |
|
Golf Loans | Aug 2015 | | — |
| | — |
| | — | | —% | | — | % | | 0.0 | | — |
| | 70,000 |
| | 69,833 |
|
| | | 600,964 |
| | 600,964 |
| | | | | | — | % | | 0.0 | | — |
| | 418,625 |
| | 418,458 |
|
Golf Credit Facilities | | | | | | | | | | | | | | | | | | | |
Golf Term Loan (D)(E) | Jun 2016 | | 102,000 |
| | 98,680 |
| | Jul 2019 | | LIBOR + 4.70% | | 7.92 | % | | 2.5 | | 102,000 |
| | — |
| | — |
|
Vineyard II | Dec 1993 | | 200 |
| | 200 |
| | Dec 2043 | | 2.20% | | 2.20 | % | | 26.9 | | 200 |
| | 200 |
| | 200 |
|
Capital Leases (Equipment) | May 2014 - Dec 2016 | | 16,404 |
| | 16,404 |
| | Sep 2018 - Jul 2022 | | 3.00% to 16.16% | | 6.56 | % | | 4.1 | | — |
| | 11,058 |
| | 11,058 |
|
| | | 118,604 |
| | 115,284 |
| | | | | | 7.72 | % | | 2.8 | | 102,200 |
| | 11,258 |
| | 11,258 |
|
Corporate | | | | | | | | | | | | | | | | | | | |
Junior subordinated notes payable | Mar 2006 | | 51,004 |
| | 51,217 |
| | Apr 2035 | | LIBOR + 2.25% | | 3.11 | % | | 18.3 | | 51,004 |
| | 51,004 |
| | 51,225 |
|
| | | 51,004 |
| | 51,217 |
| | | | | | 3.11 | % | | 18.3 | | 51,004 |
| | 51,004 |
| | 51,225 |
|
Subtotal debt obligation | | | 770,572 |
| | 767,465 |
| | | | | | 2.17 | % | | 1.7 | | $ | 153,204 |
| | 590,464 |
| | 590,036 |
|
Financing on subprime mortgage loans subject to call option | (F) | | — |
| | — |
| | | | | | | | | | | | 380,806 |
| | 380,806 |
|
Total debt obligation | | | $ | 770,572 |
| | $ | 767,465 |
| | | | | | | | | | | | $ | 971,270 |
| | $ | 970,842 |
|
See notes on next page.
DRIVE SHACK INC. AND SUBSIDIARIES
NOTES TO CONSOLIDATED FINANCIAL STATEMENTS
DECEMBER 31, 2016, 2015 and 2014
(dollars in tables in thousands, except per share data)
| |
(A) | Weighted average, including floating and fixed rate classes. |
| |
(B) | Including the effect of deferred financing cost. |
| |
(C) | These repurchase agreements had $0.3 million accrued interest payable at December 31, 2016. The counterparties on these repurchase agreements are Citi ($242.0 million) and Jeffries ($359.0 million). Drive Shack Inc. has margin exposure on $601.0 million of repurchase agreements related to the financing of FNMA/FHLMC securities. The underlying collateral of the repurchase agreements are fixed rate FNMA/FHLMC securities with the following value at December 31, 2016: $619.8 million outstanding face amount, $627.3 million amortized cost basis, $627.3 million carrying value and a weighted average life of 8.4 years. To the extent that the value of the collateral underlying these repurchase agreements declines, Drive Shack Inc. may be required to post margin, which could significantly impact its liquidity. |
| |
(D) | The golf term loan is collateralized by 22 Traditional Golf properties. The carrying amount of the golf term loan is reported net of deferred financing costs of $3.3 million as of December 31, 2016. |
| |
(E) | Interest rate based on 30 day LIBOR plus 4.70% with a LIBOR floor of 1.80%. At the time of closing, Drive Shack Inc. purchased a co-terminus LIBOR interest rate cap of 1.80%. |
| |
(F) | See Note 6 regarding the securitizations of Subprime Portfolios I and II. |
CDO, Other Bonds and Notes Payable
During the second quarter of 2015, approximately $60.3 million of CDO VIII notes were repaid primarily due to the sale of securities and loans. See Notes 5 and 6. As a result of the repayment of the CDO VIII notes, Drive Shack Inc. also repaid $13.3 million of repurchase agreements associated with CDO VIII.
During the second quarter of 2015, approximately $51.4 million of CDO IX notes were repaid primarily due to the sales and pay down of securities and loans. See Notes 5 and 6. As a result of the repayment of the CDO IX notes, Drive Shack Inc. also repaid $22.3 million of repurchase agreements associated with CDO IX.
In June 2015, Drive Shack Inc. repurchased $11.5 million face amount of CDO bonds payable issued by CDO VIII at a price of 95.50% of par for total proceeds of $11.0 million. As a result, Drive Shack Inc. extinguished $11.5 million face amount of CDO bonds payable and recorded a gain on extinguishment of debt of $0.5 million.
In October 2015, Drive Shack Inc. financed an unencumbered real estate related loan with a face amount of $19.4 million with a mezzanine note payable for $11.7 million. This note payable bears interest at one month LIBOR + 3.00%, matures in October 2016 and is subject to customary margin provisions.
In March 2016, Drive Shack Inc. deconsolidated CDO and other bonds payable, see Variable Interest Entities in Note 2 for additional details.
In April 2016, Drive Shack Inc. sold a mezzanine loan with a face amount of $19.4 million at par. Drive Shack Inc. subsequently repaid $11.7 million of notes payable that were collateralized by the loan. See Note 6.
Repurchase Agreements
See Note 5 for information about the FNMA/FHLMC repurchase agreement activity for the years ended December 31, 2016 and 2015.
Golf Credit Facilities and Repurchase Agreement
In December 2013, Traditional Golf entered into two loan agreements (“First Lien Loan” and “Second Lien Loan”) with General Electric Capital Corporation (“GECC”). In August 2015, Drive Shack Inc. acquired from GECC $51.4 million outstanding face amount of the First Lien Loan at a price of 90.0% of par, or $46.3 million, and $105.6 million outstanding face amount of the Second Lien Loan at a price of 90.0% of par, or $95.0 million. The purchases were funded with $71.3 million cash and a $70.0 million repurchase agreement. Drive Shack Inc. recorded a gain on extinguishment of debt of $15.4 million.
In February 2016, Drive Shack Inc. extended the repurchase agreement on the golf loans to mature on May 31, 2016, with an option to extend to June 30, 2016. The repurchase agreement bears interest at LIBOR + 4.00%.
In May 2016, the option on the repurchase agreement on the golf loans was exercised to extend the maturity to June 30, 2016.
In June 2016, Drive Shack Inc. obtained third-party financing on 22 traditional golf properties for a total of $102.0 million at a floating rate of the greater of: (i) 30-day LIBOR + 4.70% or (ii) 6.50%. At the time of closing, Drive Shack Inc. purchased a co-
DRIVE SHACK INC. AND SUBSIDIARIES
NOTES TO CONSOLIDATED FINANCIAL STATEMENTS
DECEMBER 31, 2016, 2015 and 2014
(dollars in tables in thousands, except per share data)
terminus LIBOR interest rate cap of 1.80%. The financing is for a term of three years with the option for two one-year extensions. Drive Shack Inc. used $64.9 million of the proceeds to repay the outstanding balance on the golf loans repurchase agreement.
Traditional Golf is obligated under a $0.2 million loan with the City of Escondido, California (“Vineyard II”). The principal amount of the loan is payable in five equal installments upon reaching the "Achievement Date”, which is the date on which the previous 36-month period equals or exceeds 240,000 rounds of golf played on the property. As of December 31, 2016, 240,000 rounds of golf have not been achieved within an applicable 36-month period. The interest rate is adjusted annually and is equal to 1% plus a short-term investment return, as defined in the loan agreement. As of December 31, 2016, the interest rate is 2.20%.
Capital Leases - Equipment
Traditional Golf leases certain golf carts and other equipment under capital lease agreements. The agreements typically provide for minimum rentals plus executory costs. Lease terms range from 36-66 months. Certain leases include bargain purchase options at lease expiration.
The future minimum lease payments required under the capital leases and the present value of the net minimum lease payments as of December 31, 2016 are as follows:
|
| | | |
2017 | $ | 4,666 |
|
2018 | 4,662 |
|
2019 | 4,511 |
|
2020 | 3,203 |
|
2021 | 1,626 |
|
Thereafter | 157 |
|
Total minimum lease payments | 18,825 |
|
Less: imputed interest | 2,421 |
|
Present value of net minimum lease payments | $ | 16,404 |
|
Maturity Table
Drive Shack Inc.’s debt obligations (gross of $3.1 million of discounts at December 31, 2016) have contractual maturities as follows:
|
| | | | | | | | | | | |
| Nonrecourse | | Recourse | | Total |
2017 | $ | 3,699 |
| | $ | 600,964 |
| | $ | 604,663 |
|
2018 | 3,945 |
| | — |
| | 3,945 |
|
2019 | 4,058 |
| | — |
| | 4,058 |
|
2020 | 104,984 |
| | — |
| | 104,984 |
|
2021 | 1,564 |
| | — |
| | 1,564 |
|
Thereafter | 354 |
| | 51,004 |
| | 51,358 |
|
Total | $ | 118,604 |
| | $ | 651,968 |
| | $ | 770,572 |
|
Debt Covenants
Drive Shack Inc.’s golf credit facilities contain various customary loan covenants, including certain coverage ratios. Drive Shack Inc. was in compliance with all of these covenants as of December 31, 2016.
DRIVE SHACK INC. AND SUBSIDIARIES
NOTES TO CONSOLIDATED FINANCIAL STATEMENTS
DECEMBER 31, 2016, 2015 and 2014
(dollars in tables in thousands, except per share data)
12. EQUITY AND EARNINGS PER SHARE
Earnings per Share
Drive Shack Inc. is required to present both basic and diluted earnings per share (“EPS”). The following table shows the amounts used in computing basic and diluted EPS:
|
| | | | | | | | | | | | |
| | For Year Ended December 31, |
| | 2016 | | 2015 | | 2014 |
Numerator for basic and diluted earnings per share: | | | | | | |
Income from continuing operations after preferred dividends and noncontrolling interest | | $ | 71,499 |
| | $ | 15,621 |
| | $ | 62,855 |
|
Income (loss) from discontinued operations, net of tax | | — |
| | 646 |
| | (35,189 | ) |
Income Applicable to Common Stockholders | | $ | 71,499 |
| | $ | 16,267 |
| | $ | 27,666 |
|
| | | | | | |
Denominator: | | | | | | |
Denominator for basic earnings per share - weighted average shares | | 66,709,925 |
| | 66,479,321 |
| | 61,500,913 |
|
Effect of dilutive securities | | | | | | |
Options | | 2,078,515 |
| | 2,168,594 |
| | 1,630,314 |
|
Denominator for diluted earnings per share - adjusted weighted average shares | | 68,788,440 |
| | 68,647,915 |
| | 63,131,227 |
|
| | | | | | |
Basic earnings per share: | | | | | | |
Income from continuing operations per share of common stock, after preferred dividends and noncontrolling interest | | $ | 1.07 |
| | $ | 0.23 |
| | $ | 1.02 |
|
Income (loss) from discontinued operations per share of common stock | | $ | — |
| | $ | 0.01 |
| | $ | (0.57 | ) |
Income Applicable to Common Stock, per share | | $ | 1.07 |
| | $ | 0.24 |
| | $ | 0.45 |
|
| | | | | | |
Diluted earnings per share: | | | | | | |
Income from continuing operations per share of common stock, after preferred dividends and noncontrolling interest | | $ | 1.04 |
| | $ | 0.23 |
| | $ | 1.00 |
|
Income (loss) from discontinued operations per share of common stock | | $ | — |
| | $ | 0.01 |
| | $ | (0.57 | ) |
Income Applicable to Common Stock, per share | | $ | 1.04 |
| | $ | 0.24 |
| | $ | 0.44 |
|
Basic EPS is calculated by dividing net income (loss) applicable to common stockholders by the weighted average number of shares of common stock outstanding during each period. Diluted EPS is calculated by dividing net income (loss) applicable to common stockholders by the weighted average number of shares of common stock outstanding plus the additional dilutive effect of common stock equivalents during each period. Due to rounding, income per share from continuing operations and income per share from discontinued operations may not sum to the income per share of common stock. Drive Shack Inc.’s common stock equivalents are its options. During 2016, 2015 and 2014, based on the treasury stock method, Drive Shack Inc. had: 2,078,515; 2,168,594; and 1,630,314; dilutive common stock equivalents, respectively, resulting from its outstanding options. As of December 31, 2016, 2015 and 2014, Drive Shack Inc. had: 309,024; 259,277; and 1,931,257 antidilutive options, respectively. Net income (loss) applicable to common stockholders is equal to net income (loss) less preferred dividends.
DRIVE SHACK INC. AND SUBSIDIARIES
NOTES TO CONSOLIDATED FINANCIAL STATEMENTS
DECEMBER 31, 2016, 2015 and 2014
(dollars in tables in thousands, except per share data)
Common Stock Offerings
The following table presents shares of common stock issued by Drive Shack Inc. in connection with public offerings since 2014:
|
| | | | | | | | | | | | | | | | | | | | | | | | | | | | | |
| | | | Price per Share | | | | Aggregate Shares purchased by Principals of Fortress | | Options Granted to Manager (A) |
Date | | Number
of Shares
Issued | | To
Public | | To Underwriters | | Net
Proceeds
(millions) | | Number
of Shares | | Price | | Number
of Shares | | Grant Date Strike
Price | | Grant Date
Value (millions) |
August 2014 | | 7,654,166 | | N/A | | $ | 25.92 |
| | $ | 197.9 |
| | 83,333 |
| | $ | 26.34 |
| | 765,416 | | $ | 26.34 |
| | $ | 1.7 |
|
| |
(A) | In connection with this offering, Drive Shack Inc. granted options to the Manager for the purpose of compensating the Manager for its role in raising capital for Drive Shack Inc. |
In December 2015, Drive Shack Inc. issued an aggregate of 18,798 shares of its common stock to its independent directors as part of annual compensation.
In May 2016 and July 2016, Drive Shack Inc. issued a total of 57,740 and 21,798 shares, respectively, of its common stock to its independent directors as a component of their annual compensation. See Note 17 for shares issued subsequent to December 31, 2016.
Option Plan
In June 2002, (with the approval of our board of directors) we adopted the Newcastle Nonqualified Stock Option and Incentive Award Plan (the "Newcastle Option Plan"), for officers, directors, consultants and advisors, including the Manager and its employees.
In May 2012, our board of directors adopted the 2012 Newcastle Nonqualified Stock Option and Incentive Plan (the "2012 Plan") which was approved by our shareholders. The 2012 Plan was adopted as the successor to the Newcastle Option Plan for officers, directors, consultants and advisors, including the Manager and its employees, and facilitated the continued use of long-term equity-based awards and incentives for the benefit of the service providers to us and our Manager.
On April 8, 2014, our board of directors adopted the 2014 Plan, which was approved by our shareholders and was amended and restated by our board of directors as of September 17, 2014 to reflect the 1-for-3 reverse stock split, which was effective after the close of trading on August 18, 2014, and as of November 3, 2014 to reflect the 1-for-2 reverse stock split, which was effective after the close of trading on October 22, 2014. The 2014 Plan was adopted as the successor to the 2012 Plan for officers, directors, consultants and advisors, including the Manager and its employees, and facilitated the continued use of long-term equity-based awards and incentives for the benefit of the service providers to us and our Manager.
On April 16, 2015, our board of directors adopted the 2015 Newcastle Investment Corp. Nonqualified Option and Incentive Award Plan (the “2015 Plan”), which was approved by our shareholders. The 2015 Plan is the successor to the 2014 Plan for officers, directors, consultants and advisors, including the Manager and its employees, and is intended to facilitate the continued use of long-term equity-based awards and incentives for the benefit of the service providers to us and our Manager. The maximum number of shares available for issuance under the 2015 Plan is 300,000 shares, as increased on the date of any equity issuance by us during the one-year term of the 2015 Plan by ten percent of the equity securities issued by us in such equity issuance.
On April 7, 2016, our board of directors adopted the 2016 Newcastle Investment Corp. Nonqualified Option and Incentive Award Plan (the “2016 Plan”), which was approved by our shareholders. The 2016 Plan is the successor to the 2015 Plan for officers, directors, consultants and advisors, including the Manager and its employees, and is intended to facilitate the continued use of long-term equity-based awards and incentives for the benefit of the service providers to us and our Manager. The maximum number of shares available for issuance under the 2016 Plan is 300,000 shares, as increased on the date of any equity issuance by us during the one-year term of the 2016 Plan by ten percent of the equity securities issued by us in such equity issuance.
All outstanding options granted under the 2015 Plan, 2014 Plan, 2012 Plan and the Newcastle Option Plan will continue to be subject to the terms and conditions set forth in the agreements evidencing such options and the terms of the 2015 Plan, 2014 Plan, 2012 Plan and the Newcastle Option Plan. Our board of directors may also determine to issue options to the Manager that are not subject to the 2016 Plan, provided that the number of shares underlying any options granted to the Manager in connection with
DRIVE SHACK INC. AND SUBSIDIARIES
NOTES TO CONSOLIDATED FINANCIAL STATEMENTS
DECEMBER 31, 2016, 2015 and 2014
(dollars in tables in thousands, except per share data)
capital raising efforts would not exceed 10% of the shares sold in such offering and would be subject to NYSE rules. Upon exercise, all options will be settled in an amount of cash equal to the excess of the fair market value of a share of common stock on the date of exercise over the strike price per share, unless advance approval is made to settle the option in shares of common stock.
On May 7, 2015, and pursuant to the anti-dilution provisions of the 2014 Plan, the 2012 Plan and Newcastle Option Plan, as applicable, Drive Shack Inc.’s board of directors approved an equitable adjustment of all outstanding options in order to account for the impact of the 2014 return of capital distributions. The equitable adjustment entails a strike price adjustment and the issuance of additional options which were determined so as to compensate for the loss in value that would have otherwise occurred as a result of the 2014 return of capital distributions. As a result of this adjustment, options relating to a total of 178,740 shares were issued on May 7, 2015 at a strike price of $1.00 per share.
Upon joining the board of directors, the non-employee directors were, in accordance with the Newcastle Option Plan or the 2015 Plan, as applicable, automatically granted options relating to an aggregate of 333 shares of common stock. The fair value of such options was not material at the date of grant.
For the purpose of compensating the Manager for its role in raising capital for Drive Shack Inc., the Manager has been granted options relating to shares of Drive Shack Inc.’s common stock, with strike prices subject to adjustment as necessary to preserve the value of such options in connection with the occurrence of certain events (including capital dividends and capital distributions made by Drive Shack Inc.). These options represented an amount equal to 10% of the shares of common stock of Drive Shack Inc. sold in its public offerings and the value of such options was recorded as an increase in equity with an offsetting reduction of capital proceeds received. The options granted to the Manager, which may be assigned by Fortress to its employees, were fully vested on the date of grant and one thirtieth of the options become exercisable on the first day of each of the following thirty calendar months, or earlier upon the occurrence of certain events, such as a change in control of Drive Shack Inc. or the termination of the Management Agreement. These options will be settled in an amount of cash equal to the excess of the fair market value of a share of common stock on the date of exercise over the strike price per share, unless a majority of the independent members of Drive Shack Inc.’s board of directors determine to settle the option in shares of common stock. The options expire ten years from the date of issuance.
In connection with the spin-off of New Residential on May 15, 2013, 3.6 million options that were held by the Manager, or by the directors, officers or employees of the Manager, were converted into an adjusted Drive Shack Inc. option and a new New Residential option. The strike price of each adjusted Drive Shack Inc. option and New Residential option was set to collectively maintain the intrinsic value of the Drive Shack Inc. option immediately prior to the spin-off of New Residential and to maintain the ratio of the strike price of the adjusted Drive Shack Inc. option and the New Residential option, respectively, to the fair market value of the underlying shares as of the spin-off date, in each case based on the five day average closing price subsequent to the spin-off date.
In connection with the spin-off of New Media on February 13, 2014, the strike price of each Drive Shack Inc. option was reduced by $5.34 to reflect the adjusted value of Drive Shack Inc.’s shares as a result of the spin-off. The adjusted value was calculated based on the five day average closing price of the New Media's shares subsequent to the spin-off date.
In connection with the spin-off of New Senior on November 6, 2014, 5.5 million options that were held by the Manager, or by the directors, officers or employees of the Manager, were converted into an adjusted Drive Shack Inc. option and a new New Senior option. The strike price of each adjusted Drive Shack Inc. option and New Senior option was set to collectively maintain the intrinsic value of the Drive Shack Inc. option immediately prior to the spin-off of New Senior and to maintain the ratio of the strike price of the adjusted Drive Shack Inc. option and the New Senior option, respectively, to the fair market value of the underlying shares as of the spin-off date, in each case based on the five day average closing price subsequent to the spin-off date.
DRIVE SHACK INC. AND SUBSIDIARIES
NOTES TO CONSOLIDATED FINANCIAL STATEMENTS
DECEMBER 31, 2016, 2015 and 2014
(dollars in tables in thousands, except per share data)
The following is a summary of the changes in Drive Shack Inc.'s outstanding options for the year ended December 31, 2016.
|
| | | | | | | | | |
| | Number of Options | | Weighted Average Strike Price | | Weighted Average Life Remaining (in years) |
Balance at December 31, 2015 | | 5,421,561 |
| | $ | 2.85 |
| | |
Granted | | 333 |
| | 3.78 |
| | |
Exercised | | (266,657 | ) | | 3.01 |
| | |
Expired | | (28,331 | ) | | 13.38 |
| | |
Balance at December 31, 2016 | | 5,126,906 |
| | $ | 2.79 |
| | 5.91 years |
| | | | | | |
Exercisable at December 31, 2016 | | 5,075,878 |
| | $ | 2.78 |
| | 5.88 years |
Drive Shack Inc.'s outstanding options were summarized as follows:
|
| | | | | | | | | | | | | | | | | |
| Year Ended December 31, 2016 | | Year Ended December 31, 2015 |
| Issued Prior
to 2011 | | Issued in 2011
and thereafter | | Total | |
Issued Prior to 2011 | | Issued in 2011
and thereafter | | Total |
Held by the Manager | 110,029 |
| | 5,010,243 |
| | 5,120,272 |
| | 115,239 |
| | 5,010,243 |
| | 5,125,482 |
|
Issued to the Manager and subsequently transferred to certain Manager’s employees | 6,301 |
| | — |
| | 6,301 |
| | 29,422 |
| | 266,657 |
| | 296,079 |
|
Issued to the independent directors | — |
| | 333 |
| | 333 |
| | — |
| | — |
| | — |
|
Total | 116,330 |
| | 5,010,576 |
| | 5,126,906 |
| | 144,661 |
| | 5,276,900 |
| | 5,421,561 |
|
The following table summarizes Drive Shack Inc.’s outstanding options at December 31, 2016. Note that the last sales price on the New York Stock Exchange for Drive Shack Inc.’s common stock in the year ended December 31, 2016 was $3.76 per share.
DRIVE SHACK INC. AND SUBSIDIARIES
NOTES TO CONSOLIDATED FINANCIAL STATEMENTS
DECEMBER 31, 2016, 2015 and 2014
(dollars in tables in thousands, except per share data)
|
| | | | | | | | | | | | | | | | | | | | |
Recipient | | Date of Grant/Exercise | | Number of Options (A) | | Options Exercisable at
December 31, 2016 | | Weighted Average
Strike Price (A) | | Fair Value At Grant
Date (millions) (B) | | Intrinsic Value at
December 31, 2016
(millions) |
Directors | | Various | | 3,666 |
| | 333 |
| | $ | — |
| | Not Material | | — |
|
Manager (C) | | 2002 - 2007 | | 587,277 |
| | 116,330 |
| | $ | 13.13 |
| | $ | 6.4 |
| | — |
|
Manager (C) | | Mar-11 | | 311,853 |
| | 206,881 |
| | $ | 1.00 |
| | $ | 7.0 |
| (J) | $ | 0.6 |
|
Manager (C) | | Sep-11 | | 524,212 |
| | 376,268 |
| | $ | 1.00 |
| | $ | 5.6 |
| (K) | $ | 1.0 |
|
Manager (C) | | Apr-12 | | 348,352 |
| | 279,452 |
| | $ | 1.00 |
| | $ | 5.6 |
| (L) | $ | 0.8 |
|
Manager (C) | | May-12 | | 396,316 |
| | 316,871 |
| | $ | 1.00 |
| | $ | 7.6 |
| (M) | $ | 0.9 |
|
Manager (C) | | Jul-12 | | 437,991 |
| | 353,674 |
| | $ | 1.00 |
| | $ | 8.3 |
| (N) | $ | 1.0 |
|
Manager (C) | | Jan-13 | | 958,331 |
| | 872,528 |
| | $ | 2.32 |
| | $ | 18.0 |
| (O) | $ | 1.3 |
|
Manager (C) | | Feb-13 | | 383,331 |
| | 349,011 |
| | $ | 2.95 |
| | $ | 8.4 |
| (P) | $ | 0.3 |
|
Manager (C) | | Jun-13 | | 670,829 |
| | 610,770 |
| | $ | 3.23 |
| | $ | 3.8 |
| (Q) | 0.4 |
|
Manager (C) | | Nov-13 | | 965,847 |
| | 879,372 |
| | $ | 3.57 |
| | $ | 6.0 |
| (R) | 0.5 |
|
Manager (C) | | Aug-14 | | 765,416 |
| | 714,388 |
| | $ | 4.01 |
| | $ | 1.7 |
| (S) | 0.3 |
|
Exercised (D) | | Prior to 2008 | | (173,853 | ) | | N/A |
| | $ | 14.09 |
| | N/A |
| | N/A |
|
Exercised (E) | | Oct-12 | | (15,972 | ) | | N/A |
| | $ | 1.48 |
| | N/A |
| | N/A |
|
Exercised (F) | | Sep-13 | | (51,306 | ) | | N/A |
| | $ | 1.67 |
| | N/A |
| | N/A |
|
Exercised (G) | | 2014 | | (216,186 | ) | | N/A |
| | $ | 1.46 |
| | N/A |
| | N/A |
|
Exercised (H) | | 2015 | | (202,446 | ) | | N/A |
| | 1.00 |
| | N/A |
| | N/A |
|
Exercised (I) | | 2016 | | (266,657 | ) | | N/A |
| | 3.01 |
| | N/A |
| | N/A |
|
Expired unexercised | | 2002-2006 | | (300,095 | ) | | N/A |
| | N/A |
| | N/A |
| | N/A |
|
Outstanding | | | | 5,126,906 |
| | 5,075,878 |
| | | | | | |
| |
(A) | The strike prices are subject to adjustment in connection with return of capital dividends and spin-offs. A portion of Drive Shack Inc.’s 2008 dividends was deemed return of capital dividends. The effect on the strike prices was not significant. In the first quarter of 2014, strike prices were adjusted by $0.32 reflecting the portion of Drive Shack Inc.'s 2013 dividends which was deemed return of capital. The strike prices were adjusted for the New Residential, New Media and New Senior spin-offs as described above. On May 7, 2015, and pursuant to the anti-dilution provisions of the 2014 Plan, 2012 Plan and Newcastle Option Plan, as applicable, Drive Shack Inc.’s board of directors approved an equitable adjustment of all outstanding options in order to account for the impact of the 2014 return of capital distributions. The equitable adjustment entails a strike price adjustment and the issuance of additional options which were determined so as to compensate for the loss in value that would have otherwise occurred as a result of the 2014 return of capital distributions. As a result of this adjustment, options relating to a total of 178,740 shares were issued on May 7, 2015 at a strike price of $1.00 per share as detailed below. |
|
| | | |
Grant Date | | Number of Options Issued |
Mar-11 | | 24,354 |
|
Sep-11 | | 92,963 |
|
Apr-12 | | 32,105 |
|
May-12 | | 12,987 |
|
Jul-12 | | 16,331 |
|
Total options issued | | 178,740 |
|
As of December 31, 2016, the weighted average strike price of the outstanding options issued prior to 2011 was $13.13.
| |
(B) | The fair value of the options was estimated using an option valuation model. Since the Newcastle Option Plan, 2012 Plan, 2014 Plan, 2015 Plan and 2016 Plan have characteristics significantly different from those of traded options, and since the assumptions used in such model, particularly the volatility assumption, are subject to significant judgment and variability, the actual value of the options could vary materially from management’s estimate. The volatility assumption for these options was estimated based primarily on the historical volatility of Drive Shack Inc.’s common stock and management’s expectations regarding future volatility. The expected life assumption for options issued prior to 2011 was estimated based on the simplified term method. This simplified method was used because Drive Shack Inc. did not have sufficient historical data to conclude on the appropriate expected life of its options and because historical data to date was consistent with the simplified term method. The expected life assumption for options issued in 2011 and thereafter was estimated based primarily on the historical expected life of applicable previously issued options. |
DRIVE SHACK INC. AND SUBSIDIARIES
NOTES TO CONSOLIDATED FINANCIAL STATEMENTS
DECEMBER 31, 2016, 2015 and 2014
(dollars in tables in thousands, except per share data)
| |
(C) | The Manager assigned certain of its options to Fortress’s employees as follows: |
|
| | | | |
Date of Grant | | Range of Strike Prices | | Total Unexercised Inception to Date |
2007 | | $12.44 - $14.44 | | 6,301 |
| | Total | | 6,301 |
| |
(D) | 111,770 of the total options exercised were by the Manager. 61,417 of the total options exercised were by employees of Fortress subsequent to their assignment. 666 of the total options exercised were by directors. |
| |
(E) | Exercised by employees of Fortress subsequent to their assignment. The options exercised had an intrinsic value of $0.2 million. |
| |
(F) | Exercised by employees of Fortress subsequent to their assignment. The options exercised had an intrinsic value of $0.9 million. |
| |
(G) | 215,853 options were exercised by employees of Fortress subsequent to their assignment with an intrinsic value of $4.1 million. 333 options were exercised by directors with a minimal intrinsic value. |
| |
(H) | Exercised by employees of Fortress subsequent to their assignment. The options exercised had an intrinsic value of $0.8 million. |
| |
(I) | Exercised by employees of Fortress subsequent to their assignment. The options exercised had an intrinsic value of $0.4 million. As a result of his resignation, the Company's former CEO forfeited 16,748 options and were transferred back to the Manager. |
| |
(J) | The assumptions used in valuing the options were: a 1.7% risk-free rate, 107.8% volatility and a 3.3 year expected term. |
| |
(K) | The assumptions used in valuing the options were: a 1.13% risk-free rate, 13.2% dividend yield, 151.1% volatility and a 4.6 year expected term. |
| |
(L) | The assumptions used in valuing the options were: a 1.3% risk-free rate, 12.9% dividend yield, 149.4% volatility and a 4.7 year expected term. |
| |
(M) | The assumptions used in valuing the options were: a 1.05% risk-free rate, 11.9% dividend yield, 148.4% volatility and a 4.8 year expected term. |
| |
(N) | The assumptions used in valuing the options were: a 0.75% risk-free rate, 11.9% dividend yield, 147.5% volatility and a 4.8 year expected term. |
| |
(O) | The assumptions used in valuing the options were: a 2.0% risk-free rate, 8.8% dividend yield, 56.2% volatility and a 10 year term. |
| |
(P) | The assumptions used in valuing the options were: a 2.1% risk-free rate, 7.8% dividend yield, 55.5% volatility and a 10 year term. |
| |
(Q) | The assumptions used in valuing the options were: a 2.5% risk-free rate, 8.8% dividend yield, 36.9% volatility and a 10 year term. |
| |
(R) | The assumptions used in valuing the options were: a 2.8% risk-free rate, 6.7% dividend yield, 32.0% volatility and a 10 year term. |
| |
(S) | The assumptions used in valuing the options were: a 2.7% risk-free rate, 8.6% dividend yield, 23.4% volatility and a 10 year term. |
Tax Benefits Preservation Plan
On December 7, 2016, our board of directors adopted a Tax Benefits Preservation Plan (the “Plan”) with American Stock Transfer and Trust Company, LLC as rights agent, and the disinterested members of the board of directors declared a dividend distribution of one right for each outstanding share of common stock to stockholders of record at the close of business on December 20, 2016. Each right is governed by the terms of the Plan and entitles the registered holder to purchase from us a unit consisting of one one-thousandth of a share of Series E Junior Participating Preferred Stock, par value $0.01 per share at a purchase price of $27.00 per unit, subject to adjustment. The Plan is intended to help protect our ability to use our tax net operating losses and certain other tax assets by deterring an “ownership change” as defined under Section 382 of the Internal Revenue Code of 1986, as amended, and the Treasury Regulations thereunder (the “Code”).
In connection with the adoption of the Plan, our board of directors approved the Articles Supplementary of Series E Junior Participating Preferred Stock, which was filed with the State Department of Assessments and Taxation of Maryland on December 8, 2016.
Preferred Stock
In March 2003, Drive Shack Inc. issued 2.5 million shares ($62.5 million face amount) of its 9.75% Series B Cumulative Redeemable Preferred Stock (the “Series B Preferred”). In October 2005, Drive Shack Inc. issued 1.6 million shares ($40.0 million face amount) of its 8.05% Series C Cumulative Redeemable Preferred Stock (the “Series C Preferred”). In March 2007, Drive Shack Inc. issued 2.0 million shares ($50.0 million face amount) of its 8.375% Series D Cumulative Redeemable Preferred Stock (the “Series D Preferred”). The Series B Preferred, Series C Preferred and Series D Preferred are non-voting, have a $25 per share liquidation preference, no maturity date and no mandatory redemption. Drive Shack Inc. has the option to redeem the Series B Preferred, the Series C Preferred and the Series D Preferred, at their liquidation preference. If the Series C Preferred or Series D Preferred cease to be listed on the NYSE or the AMEX, or quoted on the NASDAQ, and Drive Shack Inc. is not subject to the reporting requirements of the Exchange Act, Drive Shack Inc. has the option to redeem the Series C Preferred or Series D Preferred, as applicable, at their liquidation preference and, during such time any shares of Series C Preferred or Series D Preferred are outstanding, the dividend will increase to 9.05% or 9.375% per annum, respectively.
In connection with the issuance of the Series B Preferred, Series C Preferred and Series D Preferred, Drive Shack Inc. incurred approximately $2.4 million, $1.5 million, and $1.8 million of costs, respectively, which were netted against the proceeds of such offerings. If any series of preferred stock were redeemed, the related costs would be recorded as an adjustment to income available for common stockholders at that time.
DRIVE SHACK INC. AND SUBSIDIARIES
NOTES TO CONSOLIDATED FINANCIAL STATEMENTS
DECEMBER 31, 2016, 2015 and 2014
(dollars in tables in thousands, except per share data)
In March 2010, Drive Shack Inc. settled its offer to exchange (the “Exchange Offer”) shares of its common stock and cash for shares of its preferred stock. After settlement of the Exchange Offer, 1,347,321 shares of Series B Preferred Stock, 496,000 shares of Series C Preferred Stock and 620,000 shares of Series D Preferred Stock remain outstanding for trading on the New York Stock Exchange.
As of January 31, 2017, Drive Shack Inc. had paid all current and accrued dividends on its preferred stock.
Noncontrolling Interest
Drive Shack Inc.’s noncontrolling interest in 2015 and 2016 is related to our Traditional Golf business, a portion of which Drive Shack Inc. does not own. In October 2016, Drive Shack Inc. exited certain golf properties in which the Company had a noncontrolling interest. The noncontrolling interest associated with the remaining golf property has a carrying value of zero.
13. TRANSACTIONS WITH AFFILIATES AND AFFILIATED ENTITIES
Management Agreement
Drive Shack Inc. is party to a Management Agreement with FIG, LLC, its Manager and an affiliate of Fortress, which provides for automatically renewing one-year terms subject to certain termination rights. The Manager’s performance is reviewed annually and the Management Agreement may be terminated by Drive Shack Inc. by payment of a termination fee, as defined in the Management Agreement, equal to the amount of management fees earned by the Manager during the 12 consecutive calendar months immediately preceding the termination, upon the affirmative vote of at least two-thirds of the independent directors, or by a majority vote of the holders of common stock. Pursuant to the Management Agreement, the Manager provides for a management team and other professionals who are responsible for implementing our business strategy, subject to the supervision of our board of directors. Our Manager is responsible for, among other things, (i) setting investment criteria in accordance with broad investment guidelines adopted by our board of directors, (ii) sourcing, analyzing and executing acquisitions, (iii) providing financial and accounting management services and (iv) performing other duties as specified in the Management Agreement. For performing these services, Drive Shack Inc. pays the Manager an annual management fee equal to 1.5% of the gross equity of Drive Shack Inc., as defined, including adjustments for return of capital dividends.
The Management Agreement provides that Drive Shack Inc. will reimburse the Manager for various expenses incurred by the Manager or its officers, employees and agents on Drive Shack Inc.’s behalf, including costs of legal, accounting, tax, auditing, administrative and other similar services rendered for Drive Shack Inc. by providers retained by the Manager or, if provided by the Manager’s employees, in amounts which are no greater than those which would be payable to outside professionals or consultants engaged to perform such services pursuant to agreements negotiated on an arm’s-length basis. In addition to expense reimbursements for expenses incurred by the Manager, Drive Shack Inc. is responsible for reimbursing the Manager for certain expenses incurred by Drive Shack Inc. that are initially paid by the Manager on behalf of Drive Shack Inc.
To provide an incentive for the Manager to enhance the value of the common stock, the Manager is entitled to receive an incentive return (the “Incentive Compensation’’) on a cumulative, but not compounding, basis in an amount equal to the product of (A) 25% of the dollar amount by which (1) (a) the Funds from Operations (defined as the net income applicable to common stockholders before Incentive Compensation, excluding extraordinary items, plus depreciation of operating real estate and after adjustments for unconsolidated subsidiaries, if any) of Drive Shack Inc. per share of common stock (based on the weighted average number of shares of common stock outstanding) plus (b) gains (or losses) from debt restructuring and from sales of property and other assets per share of common stock (based on the weighted average number of shares of common stock outstanding), exceed (2) an amount equal to (a) the weighted average of the price per share of common stock in the initial public offering (“IPO”) and the value attributed to the net assets transferred to Drive Shack Inc. by its predecessor, and in any subsequent offerings by Drive Shack Inc. (adjusted for prior return of capital dividends or capital distributions) multiplied by (b) a simple interest rate of 10% per annum (divided by four to adjust for quarterly calculations) multiplied by (B) the weighted average number of shares of common stock outstanding.
DRIVE SHACK INC. AND SUBSIDIARIES
NOTES TO CONSOLIDATED FINANCIAL STATEMENTS
DECEMBER 31, 2016, 2015 and 2014
(dollars in tables in thousands, except per share data)
|
| | | | | | | | | | | |
| Amounts incurred under the Management
Agreement |
| 2016 | | 2015 | | 2014 |
Management Fees | $ | 10,204 |
| | $ | 10,192 |
| | $ | 20,539 |
|
Expense Reimbursement to the Manager | 500 |
| | 500 |
| | 500 |
|
Incentive Compensation | — |
| | — |
| | — |
|
Total management fees to affiliate | $ | 10,704 |
| | $ | 10,692 |
| | $ | 21,039 |
|
At December 31, 2016, Fortress, through its affiliates, and principals of Fortress, owned 4.1 million shares of Drive Shack Inc.’s common stock and Fortress, through its affiliates, had options relating to an additional 5.1 million shares of Drive Shack Inc.’s common stock (Note 12).
At December 31, 2016 and 2015, due to affiliates was comprised of $0.9 million and $0.9 million, respectively, of management fees and expense reimbursements payable to the Manager.
Other Affiliated Entities
In April 2006, Drive Shack Inc. securitized Subprime Portfolio I and, through Securitization Trust 2006, entered into a servicing agreement with a subprime home equity mortgage lender (the “Subprime Servicer”) to service this portfolio. In July 2006, private equity funds managed by an affiliate of Drive Shack Inc.’s Manager completed the acquisition of the Subprime Servicer. As compensation under the servicing agreement, the Subprime Servicer receives, on a monthly basis, a net servicing fee equal to 0.5% per annum on the unpaid principal balance of the portfolio. In March 2007, through Securitization Trust 2007, Drive Shack Inc. entered into a servicing agreement with the Subprime Servicer to service Subprime Portfolio II under substantially the same terms. At December 31, 2016, the outstanding unpaid principal balances of Subprime Portfolios I and II were approximately $237.6 million and $349.8 million, respectively.
In April 2010, Drive Shack Inc., through two of its CDOs, made a cash investment of $75.0 million in the resorts-related loan to a portfolio company of a private equity fund managed by an affiliate of Drive Shack Inc.’s Manager. Drive Shack Inc.’s chairman is a director of and has an indirect ownership interest in the borrower. This investment improved the applicable CDOs’ results under some of their respective tests, and is expected to yield approximately 22.5%. The maturity of the resorts-related loan has been extended to June 2019. Interest on the loan will be accrued and deferred until maturity.
In September 2016, Drive Shack Inc. received a $109.9 million pay down on the loan. As of December 31, 2016, Drive Shack Inc. held on its balance sheet total investments of $61.0 million face amount of loans issued by affiliates of the Manager. Drive Shack Inc. earned approximately $29.0 million, $25.8 million and $20.0 million of interest on investments issued by affiliates of the Manager for the years ended December 31, 2016, 2015 and 2014, respectively.
In each instance described above, affiliates of Drive Shack Inc.’s Manager have an investment in the applicable affiliated fund and receive from the fund, in addition to management fees, incentive compensation if the fund’s aggregate investment returns exceed certain thresholds.
A principal of the Manager owned or leased aircraft that Drive Shack Inc. chartered from a third-party aircraft operator for business purposes in the course of operations. Drive Shack Inc. paid the aircraft operator market rates for the charters. These amounts totaled $0.1 million and less than $0.1 million for the years ended December 31, 2016 and 2015, respectively.
14. COMMITMENTS AND CONTINGENCIES
Litigation — Drive Shack Inc. is and may become, from time to time, involved in legal actions in the ordinary course of business, including governmental and administrative investigations, inquiries and proceedings concerning employment, labor, environmental and other claims. Although management is unable to predict with certainty the eventual outcome of any legal action, management believes the ultimate liability arising from such actions, individually and in the aggregate, which existed at December 31, 2016, will not materially affect Drive Shack Inc.’s consolidated results of operations, financial position or cash flow. Given the inherent unpredictability of these types of proceedings, however, it is possible that future adverse outcomes could have a material effect on our financial results.
DRIVE SHACK INC. AND SUBSIDIARIES
NOTES TO CONSOLIDATED FINANCIAL STATEMENTS
DECEMBER 31, 2016, 2015 and 2014
(dollars in tables in thousands, except per share data)
Environmental Costs — As a commercial real estate owner, Drive Shack Inc. is subject to potential environmental costs. At December 31, 2016, management of Drive Shack Inc. is not aware of any environmental concerns that would have a material adverse effect on Drive Shack Inc.’s consolidated financial position or results of operations.
Debt Covenants — Drive Shack Inc.’s debt obligations contain various customary loan covenants, including certain coverage ratios. See Note 11.
Operating lease obligations – Traditional Golf leases many of its golf courses and related facilities under long-term operating leases, including triple net leases. In addition to minimum payments, certain leases require the payment of the excess of various percentages of gross revenue or net operating income over the minimum rental payments. The triple net leases require the payment of taxes assessed against the leased property and the cost of insurance and maintenance. The majority of the lease terms range from 10 to 20 years and, typically, the leases contain renewal options. Certain leases include minimum scheduled increases in rental payments at various times during the term of the lease. These scheduled rent increases are recognized on a straight-line basis over the term of the lease, resulting in an accrual, which is included in accounts payable, accrued expenses and other liabilities, for the amount by which the cumulative straight-line rent exceeds the contractual cash rent.
Traditional Golf is required to maintain bonds under certain third-party agreements, as requested by certain utility providers, and under the rules and regulations of licensing authorities and other governmental agencies. The Golf business had bonds outstanding of approximately $0.9 million as of December 31, 2016 and December 31, 2015.
Traditional Golf leases certain golf carts and equipment under operating leases that range from one to three years. Rental expenses recorded under operating leases for carts and equipment were $3.8 million and $4.6 million for the years ended December 31, 2016 and 2015, respectively.
Traditional Golf has three month-to-month property leases which are cancellable by the parties with 30 days written notice. Traditional Golf also has various month-to-month operating leases for carts and equipment. The aggregate monthly expense of these leases was $0.3 million. The future minimum rental commitments under non-cancellable leases, net of subleases, as of December 31, 2016 were as follows:
|
| | | |
For the years ending December 31: |
|
2017 | $ | 31,787 |
|
2018 | 28,442 |
|
2019 | 25,362 |
|
2020 | 22,017 |
|
2021 | 18,384 |
|
Thereafter | 130,284 |
|
Total Minimum lease payments | $ | 256,276 |
|
Membership Deposit Liability – In the Traditional Golf business, private country club members generally pay an advance initiation fee deposit upon their acceptance as a member to the respective country club. Initiation fee deposits are refundable 30 years after the date of acceptance as a member. As of December 31, 2016, the total face amount of initiation fee deposits was approximately $246.1 million.
Restricted Cash – Approximately $6.2 million of restricted cash at December 31, 2016 is used as credit enhancement for Traditional Golf’s obligations related to the performance of lease and loan agreements and certain insurance claims.
DRIVE SHACK INC. AND SUBSIDIARIES
NOTES TO CONSOLIDATED FINANCIAL STATEMENTS
DECEMBER 31, 2016, 2015 and 2014
(dollars in tables in thousands, except per share data)
15. INCOME TAXES
The provision for income taxes (including discontinued operations) consists of the following:
|
| | | | | | | | | | | |
| Year Ended December 31, |
| 2016 | | 2015 | | 2014 |
Current: | | | | | |
Federal | $ | 28 |
| | $ | 298 |
| | $ | 704 |
|
State and Local | 64 |
| | 101 |
| | 318 |
|
Total Current Provision | $ | 92 |
| | $ | 399 |
| | $ | 1,022 |
|
| | | | | |
Deferred | | | | | |
Federal | $ | 83 |
| | $ | (46 | ) | | $ | (1,293 | ) |
State and Local | 14 |
| | (8 | ) | | (632 | ) |
Total Deferred Provision | $ | 97 |
| | $ | (54 | ) | | $ | (1,925 | ) |
Total Provision (benefit) for Income Taxes | $ | 189 |
| | $ | 345 |
| | $ | (903 | ) |
Provision (benefit) for income taxes from discontinued operations | $ | — |
| | $ | — |
| | $ | (1,111 | ) |
Provision (benefit) for income taxes from continuing operations | $ | 189 |
| | $ | 345 |
| | $ | 208 |
|
On February 23, 2017, Drive Shack Inc. revoked its election to be treated as a REIT effective January 1, 2017. The Company operated in a manner intended to qualify as a REIT for federal income tax purposes through the tax year ending December 31, 2016.
Common stock distributions relating to 2016, 2015, and 2014 were taxable as follows: |
| | | | | | | | | | | | |
| Dividends Per Share | | Ordinary Income | | Long-term Capital Gain | | Return of Capital |
2016 | $ | 0.48 |
| | 0.00 | % | | 100.00 | % | | 0.00 | % |
2015 | $ | 0.60 |
|
| 30.41 | % | | 69.59 | % | | 0.00 | % |
2014 | $ | 25.76 |
| (A) | 32.64 | % | | 7.57 | % | | 59.79 | % |
| |
(A) | Includes the distribution of New Media common stock valued at $5.34 per share and the distribution of New Senior common stock valued at $18.02 per share. |
During 2010 and 2009, Drive Shack Inc. repurchased an aggregate of $787.8 million face amount of its outstanding CDO debt and junior subordinated notes at a discount and recorded $521.1 million of aggregate gain. The gain recorded upon such cancellation of indebtedness is characterized as ordinary income for tax purposes. In compliance with current tax laws, Drive Shack Inc. has the ability to defer such ordinary income to future years and has deferred all or a portion of such gain for 2010 and 2009. However, cancellation of indebtedness income recognized on or after January 1, 2011 cannot be deferred and must generally be recognized as ordinary income in the year of such cancellation. During 2011, Drive Shack Inc. repurchased $188.9 million face amount of its outstanding CDO debt and notes payable at a discount and recorded $81.1 million of gain for tax purposes, of which only $66.1 million gain relating to $171.8 million face amount of debt repurchased was recognized for GAAP purposes. During 2012, Drive Shack Inc. repurchased $39.3 million face amount of Drive Shack Inc. CDO debt and notes payable at a discount and recorded a $24.1 million gain on extinguishment of debt for GAAP, of which only $23.2 million of gain relating to $34.1 million face amount of debt repurchased was recognized for tax purposes. During 2013, Drive Shack Inc. repurchased $35.9 million face amount of Drive Shack Inc. CDO debt and notes payable at a discount and recorded a $4.6 million gain on extinguishment of debt for GAAP and tax purposes. During 2014, Drive Shack Inc. did not repurchase any of the outstanding CDO debt and notes payable. During 2015, Drive Shack Inc. repurchased $11.5 million face amount of Drive Shack Inc. CDO debt and notes payable at a discount and recorded a $0.5 million gain on extinguishment of debt for GAAP and tax purposes.
In addition, Drive Shack Inc. may recognize material ordinary income from the cancellation of debt within its non-recourse financing, and structures, including its subprime securitizations, while losses on the related collateral may be recognized as capital losses. Through December 31, 2016, $164.8 million of debt in Drive Shack Inc.’s subprime securitizations has been cancelled as a result of losses incurred on the underlying assets in the securitization trusts.
DRIVE SHACK INC. AND SUBSIDIARIES
NOTES TO CONSOLIDATED FINANCIAL STATEMENTS
DECEMBER 31, 2016, 2015 and 2014
(dollars in tables in thousands, except per share data)
As of December 31, 2015, Drive Shack Inc. had a net operating loss carryforward of approximately $526.2 million. The net operating loss carryforward can generally be used to offset future taxable income for up to 20 years. The amount of net operating loss carryforward as of December 31, 2016 is subject to the finalization of the 2016 tax returns. The net operating loss carryforward will begin to expire in 2029.
Drive Shack Inc. experienced an “ownership change” for purposes of Section 382 of the Code in January 2013. The provisions of Section 382 of the Code will impose an annual limit on the amount of net operating loss and net capital loss carryforwards that Drive Shack Inc. can use to offset future taxable income.
The Traditional Golf business is held through TRSs and, as such, is subject to regular corporate income taxes. At December 31, 2016, Drive Shack Inc.’s TRSs had approximately $68.1 million of net operating loss carryforwards for federal and state income tax purposes which may be available to offset future taxable income, if any. These federal and state net operating loss carryforwards will begin to expire in 2018. A significant portion of these net operating losses are subject to the limitations of Code Section 382. This section provides substantial limitations on the availability of net operating losses to offset current taxable income if significant ownership changes have occurred for federal tax purposes.
Drive Shack Inc. and its subsidiaries file income tax returns with the U.S. federal government and various state and local jurisdictions. Generally, Drive Shack Inc. is no longer subject to tax examinations by tax authorities for years prior to 2013. Drive Shack Inc. has assessed its tax positions for all open years and concluded that there are no material uncertainties to be recognized. Drive Shack Inc. does not believe that it is reasonably possible that the total amount of unrecognized tax benefits will significantly change within the next twelve months.
The 2014 federal income tax return for one of Drive Shack Inc.’s subsidiaries is currently under examination. At this time, Drive Shack Inc. cannot estimate when the examination will conclude or the impact such examination will have on its Consolidated Financial Statements, if any.
Drive Shack Inc. is subject to significant tax risks. In light of the revocation of its REIT election, Drive Shack Inc. will be subject to U.S. federal corporate income tax (including any applicable alternative minimum tax), which could be material.
During the years ended December 31, 2016, 2015 and 2014, Drive Shack Inc.’s subsidiaries recorded approximately $0.2 million, $0.3 million and $(0.9) million, respectively, of income tax expense (benefit). Generally, the Drive Shack Inc.’s effective tax rate differs from the federal statutory rate as a result of state and local taxes.
The difference between Drive Shack Inc.'s reported provision for income taxes and the U.S. federal statutory rate of 35% is as follows:
|
| | | | | | | | |
| December 31, |
| 2016 | | 2015 | | 2014 |
Provision at the statutory rate | 35.00 | % | | 35.00 | % | | 35.00 | % |
Non-taxable REIT income | (51.97 | )% | | (86.91 | )% | | (56.20 | )% |
Permanent items | 0.23 | % | | 31.24 | % | | — | % |
State and local taxes | 0.07 | % | | 0.32 | % | | (1.18 | )% |
Valuation allowance (reversal) | 15.56 | % | | 22.04 | % | | 21.70 | % |
Other | 1.35 | % | | (0.04 | )% | | (1.80 | )% |
Total provision (benefit) | 0.24 | % | | 1.65 | % | | (2.48 | )% |
The tax effects of temporary differences that give rise to significant portions of the deferred tax assets as of December 31, 2016 and 2015 are presented below:
DRIVE SHACK INC. AND SUBSIDIARIES
NOTES TO CONSOLIDATED FINANCIAL STATEMENTS
DECEMBER 31, 2016, 2015 and 2014
(dollars in tables in thousands, except per share data)
|
| | | | | | | |
| December 31, |
| 2016 | | 2015 |
Deferred tax assets: | | | |
Allowance for loan losses | $ | 358 |
| | $ | 399 |
|
Depreciation and amortization | 38,598 |
| | 33,495 |
|
Accrued expenses | 2,885 |
| | 2,008 |
|
Interest | 16,503 |
| | — |
|
Net operating losses | 162,629 |
| | 22,524 |
|
Other | 2,036 |
| | — |
|
Total deferred tax assets | 223,009 |
| | 58,426 |
|
Less valuation allowance | (133,192 | ) | | (42,158 | ) |
Net deferred tax assets | $ | 89,817 |
| | $ | 16,268 |
|
Deferred tax liabilities: | | | |
Leaseholds | 13,681 |
| | 15,366 |
|
Cancellation of debt | 75,632 |
| | — |
|
Other | 504 |
| | 805 |
|
Total deferred tax liabilities | $ | 89,817 |
| | $ | 16,171 |
|
Net deferred tax assets (A) | $ | — |
| | $ | 97 |
|
| |
(A) | Recorded in receivables and other assets on the Consolidated Balance Sheets. |
In assessing the realizability of deferred tax assets, management considers whether it is more likely than not that some portion or all of the deferred tax assets will not be realized. The ultimate realization of deferred tax assets is dependent upon the generation of future taxable income during the periods in which temporary differences become deductible.
Drive Shack Inc. recorded a valuation allowance against its deferred tax assets as of December 31, 2016 as management does not believe that it is more likely than not that the deferred tax assets will be realized.
The following table summarizes the change in the deferred tax asset valuation allowance:
|
| | | |
Valuation allowance at December 31, 2015 | $ | 42,158 |
|
Increase due to tax status change | 77,342 |
|
Current year income | 13,692 |
|
Valuation allowance at December 31, 2016 | $ | 133,192 |
|
DRIVE SHACK INC. AND SUBSIDIARIES
NOTES TO CONSOLIDATED FINANCIAL STATEMENTS
DECEMBER 31, 2016, 2015 and 2014
(dollars in tables in thousands, except per share data)
16. IMPAIRMENT (REVERSAL)
The following table summarizes the amounts Drive Shack Inc. recorded in the Consolidated Statements of Operations:
|
| | | | | | | | | | | | |
| | Year Ended December 31, |
| | 2016 | | 2015 | | 2014 |
Traditional golf properties (A) | | $ | 6,232 |
| | $ | — |
| | $ | — |
|
Debt and equity securities | | 110 |
| | 2,355 |
| | — |
|
Valuation allowance (reversal) on loans (B) | | 4,039 |
| | 9,541 |
| | (2,419 | ) |
Total impairment (reversal) | | $ | 10,381 |
| | $ | 11,896 |
| | $ | (2,419 | ) |
| |
(A) | Held for Use Impairment: As of December 31, 2016, the Company evaluated the recoverability of the carrying value of its golf properties in Oregon and California using an undiscounted cash flow model. Based on the analysis, it was determined that due primarily to a reduction in management’s intended hold period, the Company would not recover the carrying value of these properties located in our Traditional Golf segment. Accordingly, the Company recorded an impairment charge of $2.7 million at December 31, 2016 reducing the aggregate carrying values of these properties from $4.1 million to their estimated fair values of $1.4 million. The Company determined these impairments based on determination of fair value using internal cash flow models and sales data gathered from market participants. As the fair value inputs utilized are unobservable, the Company determined that the significant inputs used to value this real estate investments falls within Level 3 for fair value reporting. See Note 7 for additional information. |
Held for Sale Impairment: On December 2, 2016, the Company entered into a letter of intent to sell a golf property located in New Jersey. As of December 31, 2016, the Company classified the property as held for sale in accordance with applicable accounting standards for long lived assets. The carrying value of the property exceeded the fair value less anticipated costs to sell. As a result, the Company recognized an impairment loss totaling approximately $3.6 million as of December 31, 2016. The fair value measurement was based on the pricing in the letter of intent and determined that the significant inputs used to value this real estate investment falls within Level 3 for fair value reporting. See Note 2 and Note 7 for additional information.
| |
(B) | See Note 6 for additional information. |
17. SUBSEQUENT EVENTS
These financial statements include a discussion of material events which have occurred subsequent to December 31, 2016 through the issuance of these Consolidated Financial Statements.
On January 3, 2017, Drive Shack Inc. issued an aggregate of 18,074 shares of its common stock to its independent directors as a component of their annual compensation.
On February 27, 2017, Drive Shack Inc. declared dividends of $0.609375, $0.503125, and $0.523438 per share on the 9.750% Series B, 8.050% Series C and 8.375% Series D preferred stock, respectively, for the period beginning February 1, 2017 and ending April 30, 2017. Dividends totaling $1.4 million will be paid on April 28, 2017 to shareholders of record on March 10, 2017.
DRIVE SHACK INC. AND SUBSIDIARIES
NOTES TO CONSOLIDATED FINANCIAL STATEMENTS
DECEMBER 31, 2016, 2015 and 2014
(dollars in tables in thousands, except per share data)
18. SUMMARY QUARTERLY CONSOLIDATED FINANCIAL INFORMATION (UNAUDITED)
|
| | | | | | | | | | | | | | | | | | | |
2016 | Quarter Ended | | Year Ended |
| March 31 (A) | | June 30 (A) | | September 30 (A) | | December 31 (B) | | December 31 |
Total revenues | $ | 62,158 |
| | $ | 84,484 |
| | $ | 83,162 |
| | $ | 69,076 |
| | $ | 298,880 |
|
Total operating costs | 78,774 |
| | 89,706 |
| | 82,382 |
| | 87,192 |
| | 338,054 |
|
Operating income (loss) | (16,616 | ) | | (5,222 | ) | | 780 |
| | (18,116 | ) | | (39,174 | ) |
Total other income (expenses) | 89,955 |
| | 8,518 |
| | 19,677 |
| | (1,451 | ) | | 116,699 |
|
Income tax expense (benefit) | 44 |
| | 138 |
| | (38 | ) | | 45 |
| | 189 |
|
Income (loss) from continuing operations | 73,295 |
| | 3,158 |
| | 20,495 |
| | (19,612 | ) | | 77,336 |
|
Income from discontinued operations | — |
| | — |
| | — |
| | — |
| | — |
|
Preferred dividends | (1,395 | ) | | (1,395 | ) | | (1,395 | ) | | (1,395 | ) | | (5,580 | ) |
Net loss (income) attributable to noncontrolling interest | 124 |
| | (112 | ) | | (177 | ) | | (92 | ) | | (257 | ) |
Income (loss) applicable to common stockholders | $ | 72,024 |
| | $ | 1,651 |
| | $ | 18,923 |
| | $ | (21,099 | ) | | $ | 71,499 |
|
Income (loss) applicable to common stock, per share | | | | | | | | | |
Basic | $ | 1.08 |
| | $ | 0.02 |
| | $ | 0.28 |
| | $ | (0.32 | ) | | $ | 1.07 |
|
Diluted | $ | 1.05 |
| | $ | 0.02 |
| | $ | 0.27 |
| | $ | (0.32 | ) | | $ | 1.04 |
|
Income from discontinued operations per share of common stock | | | | | | | | | |
Basic | $ | — |
| | $ | — |
| | $ | — |
| | $ | — |
| | $ | — |
|
Diluted | $ | — |
| | $ | — |
| | $ | — |
| | $ | — |
| | $ | — |
|
Weighted average number of shares of common stock outstanding | | | | | | | | | |
Basic | 66,654,598 |
| | 66,681,248 |
| | 66,730,583 |
| | 66,772,360 |
| | 66,709,925 |
|
Diluted | 68,284,898 |
| | 68,899,515 |
| | 69,072,676 |
| | 66,772,360 |
| | 68,788,440 |
|
| | | | | | | | | |
2015 | Quarter Ended | | Year Ended |
| March 31 (A) (B) | | June 30 (A) | | September 30 (A) | | December 31 (B) | | December 31 |
Total revenues | $ | 60,826 |
| | $ | 82,803 |
| | $ | 82,864 |
| | $ | 69,363 |
| | $ | 295,856 |
|
Total operating costs | 72,639 |
| | 66,020 |
| | 97,539 |
| | 81,899 |
| | 318,097 |
|
Operating income (loss) | (11,813 | ) | | 16,783 |
| | (14,675 | ) | | (12,536 | ) | | (22,241 | ) |
Total other income (expenses) | 10,866 |
| | 1,085 |
| | 23,832 |
| | 7,711 |
| | 43,494 |
|
Income tax expense | 46 |
| | 27 |
| | 1,257 |
| | (985 | ) | | 345 |
|
Income (loss) from continuing operations | (993 | ) | | 17,841 |
| | 7,900 |
| | (3,840 | ) | | 20,908 |
|
Income (loss) from discontinued operations | 115 |
| | 524 |
| | 7 |
| | — |
| | 646 |
|
Preferred dividends | (1,395 | ) | | (1,395 | ) | | (1,395 | ) | | (1,395 | ) | | (5,580 | ) |
Net income attributable to noncontrolling interest | 181 |
| | 49 |
| | (13 | ) | | 76 |
| | 293 |
|
Income (loss) applicable to common stockholders | $ | (2,092 | ) | | $ | 17,019 |
| | $ | 6,499 |
| | $ | (5,159 | ) | | $ | 16,267 |
|
Income (loss) applicable to common stock, per share | | | | | | | | | |
Basic | $ | (0.03 | ) | | $ | 0.26 |
| | $ | 0.10 |
| | $ | (0.08 | ) | | $ | 0.24 |
|
Diluted | $ | (0.03 | ) | | $ | 0.25 |
| | $ | 0.09 |
| | $ | (0.08 | ) | | $ | 0.24 |
|
Income (loss) from discontinued operations per share of common stock | | | | | | | | | |
Basic | $ | — |
| | $ | 0.01 |
| | $ | — |
| | $ | — |
| | $ | 0.01 |
|
Diluted | $ | — |
| | $ | 0.01 |
| | $ | — |
| | $ | — |
| | $ | 0.01 |
|
Weighted average number of shares of common stock outstanding | | | | | | | | | |
Basic | 66,424,508 |
| | 66,426,980 |
| | 66,484,962 |
| | 66,579,072 |
| | 66,479,321 |
|
Diluted | 66,424,508 |
| | 69,204,717 |
| | 69,069,659 |
| | 66,579,072 |
| | 68,647,915 |
|
| |
(A) | The Income Applicable to Common Stockholders shown agrees with Drive Shack Inc.’s quarterly report(s) on Form 10-Q as filed with the Securities and Exchange Commission. However, individual line items may vary from such report(s) due to the transformation to a leisure and entertainment business (Note 2), operations of properties sold, or classified as held for sale, during subsequent periods being retroactively reclassified to Income for Discontinued Operations for all periods presented (Note 3). |
| |
(B) | The options outstanding are excluded from the diluted share calculation as their effect would have been anti-dilutive. |
Item 9. Changes in and Disagreements with Accountants on Accounting and Financial Disclosure.
None.
Item 9A. Controls and Procedures.
| |
a) | Disclosure Controls and Procedures. The Company’s management, with the participation of the Company’s Chief Executive Officer and Chief Financial Officer, has evaluated the effectiveness of the Company’s disclosure controls and procedures (as such term defined in Rules 13a-15(e) and 15d-15(e) under the Exchange Act as of the end of the period covered by this report. The Company’s disclosure controls and procedures are designed to provide reasonable assurance that information is recorded, processed, summarized and reported accurately and completely. Based on such evaluation, the Company’s Chief Executive Officer and Chief Financial Officer have concluded that, as of the end of such period, the Company’s disclosure controls and procedures are effective. |
| |
b) | Changes in Internal Control Over Financial Reporting. There have not been any changes in the Company’s internal control over financial reporting (as such term is defined in Rules 13a-15(f) and 15d-15(f) under the Exchange Act) during the Company's last fiscal quarter October 2016 to December 2016, that have materially affected, or are reasonably likely to materially affect, the Company’s internal control over financial reporting. |
Management’s Report on Internal Control Over Financial Reporting
Management of the Company is responsible for establishing and maintaining adequate internal control over financial reporting. Internal control over financial reporting is defined in Rule 13a-15(f) and 15d-15(f) under the Exchange Act, as a process designed by, or under the supervision of, the Company’s principal executive and principal financial officers and effected by the Company’s board of directors, management and other personnel to provide reasonable assurance regarding the reliability of financial reporting and the preparation of financial statements for external purposes in accordance with accounting principles generally accepted in the United States and includes those policies and procedures that:
| |
▪ | pertain to the maintenance of records that in reasonable detail accurately and fairly reflect the transactions and dispositions of the assets of the Company; |
| |
▪ | provide reasonable assurance that transactions are recorded as necessary to permit preparation of financial statements in accordance with accounting principles generally accepted in the United States, and that receipts and expenditures of the Company are being made only in accordance with authorizations of management and directors of the Company; and |
| |
▪ | provide reasonable assurance regarding prevention or timely detection of unauthorized acquisition, use or disposition of the Company’s assets that could have a material effect on the financial statements. |
Because of its inherent limitations, internal control over financial reporting may not prevent or detect all misstatements. Projections of any evaluation of effectiveness to future periods are subject to the risks that controls may become inadequate because of changes in conditions, or that the degree of compliance with the policies or procedures may deteriorate.
Management assessed the effectiveness of the Company’s internal control over financial reporting as of December 31, 2016. In making this assessment, management used the criteria set forth by the Committee of Sponsoring Organizations of the Treadway Commission (COSO) in the Internal Control-Integrated Framework (2013).
Based on our assessment, management concluded that, as of December 31, 2016, the Company’s internal controls over financial reporting was effective.
The effectiveness of the Company’s internal control over financial reporting as of December 31, 2016 has been audited by Ernst & Young LLP, an independent registered public accounting firm, as stated in their report included herein.
Item 9B. Other Information.
None.
PART III
Item 10. Directors, Executive Officers and Corporate Governance.
Incorporated by reference to the information under the captions “Proposal No. 1 Election of Directors,” “Our Executive Officers” and “Section 16(a) Beneficial Ownership Reporting Compliance” in our definitive proxy statement relating to the 2017 Annual Meeting of Stockholders to be filed with the SEC (our “Definitive Proxy Statement”).
Item 11. Executive Compensation.
Incorporated by reference to the information under the caption “Executive and Manager Compensation” in our Definitive Proxy Statement.
Item 12. Security Ownership of Certain Beneficial Owners and Management and Related Stockholder Matters.
Incorporated by reference to the information under the caption “Security Ownership of Certain Beneficial Owners and Management and Related Stockholder Matters” in our Definitive Proxy Statement. See also information provided under “Nonqualified Option and Incentive Award Plans” in Part II, Item 5. “Market for Registrant’s Common Equity, Related Stockholder Matters, and Issuer Purchases of Equity Securities” of this report.
Item 13. Certain Relationships and Related Transactions, Director Independence.
Incorporated by reference to the information under the captions “Certain Relationships and Related Transactions” and “Proposal No. 1 Election of Directors-Determination of Director Independence” in our Definitive Proxy Statement.
Item 14. Principal Accounting Fees and Services.
Incorporated by reference to the information under the caption “Principal Accountant Fees and Services” in our Definitive Proxy Statement.
PART IV
Item 15. Exhibits; Financial Statement Schedules.
|
| | |
(a) | and (c) Financial statements and schedules: |
| See “Financial Statements and Supplementary Data.” |
| |
(b) | Exhibits filed with this Form 10-K: |
| |
| 2.1 † | Separation and Distribution Agreement dated April 26, 2013, between New Residential Investment Corp. and the Registrant (incorporated by reference to the Registrant’s Quarterly Report on Form 10-Q, Exhibit 2.1, filed on May 3, 2013). |
| | |
| 2.2 † | Separation and Distribution Agreement dated October 16, 2014, between New Senior Investment Group Inc. and the Registrant (incorporated by reference to the Registrant's Quarterly Report on Form 10-Q, Exhibit 3.2, filed on November 5, 2014). |
| | |
| 3.1 | Articles of Restatement (incorporated by reference to the Registrant’s Report on Form 8-K, Exhibit 3.1, filed on December 8, 2016). |
| | |
| 3.2 | Articles Supplementary relating to the Series B Preferred Stock (incorporated by reference to the Registrant’s Quarterly Report on Form 10-Q, Exhibit 3.3, filed on May 13, 2003). |
| | |
| 3.3 | Articles Supplementary relating to the Series C Preferred Stock (incorporated by reference to the Registrant’s Report on Form 8-K, Exhibit 3.3, filed on October 25, 2005). |
| | |
| 3.4 | Articles Supplementary relating to the Series D Preferred Stock (incorporated by reference to the Registrant’s Report on Form 8-A, Exhibit 3.1, filed on March 14, 2007). |
| | |
| 3.5 | Articles Supplementary of Series E Junior Participating Preferred Stock dated December 8, 2016. |
| | |
| 3.6 | Amended and Restated By-laws (incorporated by reference to the Registrant’s Report on Form 8-K, Exhibit 3.4, filed on December 8, 2016). |
| | |
| 4.1 | Junior Subordinated Indenture between Newcastle Investment Corp. and The Bank of New York Mellon Trust Company, National Association, dated April 30, 2009 (incorporated by reference to the Registrant’s Report on Form 8-K, Exhibit 4.1, filed on May 4, 2009). |
| | |
| 4.2 | Pledge and Security Agreement between Newcastle Investment Corp. and The Bank of New York Mellon Trust Company, National Association, as trustee, dated April 30, 2009 (incorporated by reference to the Registrant’s Report on Form 8-K, Exhibit 4.2, filed on May 4, 2009). |
| | |
| 4.3 | Pledge, Security Agreement and Account Control Agreement among Newcastle Investment Corp., NIC TP LLC, as pledgor, and The Bank of New York Mellon Trust Company, National Association, as bank and trustee, dated April 30, 2009 (incorporated by reference to the Registrant’s Report on Form 8-K, Exhibit 4.3, filed on May 4, 2009). |
| | |
| 4.4 | Tax Benefits Preservation Plan, dated as of December 7, 2016, between Newcastle Investment Corp. and American Stock Transfer & Trust Company, LLC (incorporated by reference to the Registrant’s Report on Form 8-K, Exhibit 4.1, filed on December 8, 2016). |
| | |
| 10.1 | Amended and Restated Management and Advisory Agreement by and among the Registrant and FIG LLC, dated January 1, 2017. |
| | |
| 10.2 | 2012 Newcastle Investment Corp. Nonqualified Stock Option and Incentive Award Plan, adopted as of May 7, 2012 (incorporated by reference to the Registrant’s Report on Form 10-K, Exhibit 10.3, filed on February 28, 2013). |
| | |
|
| | |
| 10.3 | Amended and Restated 2014 Newcastle Investment Corp. Nonqualified Stock Option and Incentive Award Plan, adopted as of November 3, 2014 (incorporated by reference to the Registrant's Report on Form 10-K, Exhibit 10.5, filed on March 2, 2015). |
| | |
| 10.4 | 2015 Newcastle Investment Corp. Nonqualified Option and Incentive Award Plan, adopted as of April 16, 2015 (incorporated by reference to Annex A of the Registrant's definitive proxy statement for the 2015 annual meeting of stockholders filed on April 17, 2015). |
| | |
| 10.5 | 2016 Newcastle Investment Corp. Nonqualified Option and Incentive Award Plan (incorporated by reference to the Registrant's Report on Form 8-K, Exhibit 10.1 filed on May 19, 2016). |
| | |
| 10.6 | Exchange Agreement between Newcastle Investment Corp. and Taberna Preferred Funding IV, Ltd., Taberna Preferred Funding V, Ltd., Taberna Preferred Funding VI, Ltd. And Taberna Preferred Funding VII, Ltd., dated April 30, 2009 (incorporated by reference to the Registrant’s Report on Form 8-K, Exhibit 10.1, filed on May 4, 2009). |
| | |
| 10.7 | Exchange Agreement, dated as of January 29, 2010, by and among Newcastle Investment Corp., Taberna Capital Management, LLC, Taberna Preferred Funding IV, Ltd., Taberna Preferred Funding V, Ltd., Taberna Preferred Funding VI, Ltd. And Taberna Preferred Funding VII, Ltd. (incorporated by reference to the Registrant’s Report on Form 8-K, Exhibit 10.1, filed on February 2, 2010). |
| | |
| 10.8 | Sale and Cooperation Agreement, dated September 7, 2012, among Newcastle Investment Corp., Barclays Bank PLC and ED LIMITED (incorporated by reference to the Registrant’s Report on Form 10- Q, Exhibit 10.33, filed on October 26, 2012). |
| | |
| 10.9 | Form of Indemnification Agreement (incorporated by reference to the Registrant's Report on Form 10-Q, Exhibit 10.19, filed on August 8, 2014). |
| | |
| 12.1 | Statements re: Computation of Ratios. |
| | |
| 21.1 | Subsidiaries of the Registrant. |
| | |
| 23.1 | Consent of Ernst & Young LLP, independent registered public accounting firm. |
|
| | | |
| 31.1 | Certification of Chief Executive Officer as adopted pursuant to Section 302 of the Sarbanes-Oxley Act of 2002. |
| | | |
| 31.2 | Certification of Chief Financial Officer as adopted pursuant to Section 302 of the Sarbanes-Oxley Act of 2002. |
| | | |
| 32.1 | Certification of Chief Executive Officer pursuant to 18 U.S.C. Section 1350, as adopted pursuant to Section 906 of the Sarbanes-Oxley Act of 2002. |
| | | |
| 32.2 | Certification of Chief Financial Officer pursuant to 18 U.S.C. Section 1350, as adopted pursuant to Section 906 of the Sarbanes-Oxley Act of 2002. |
| | |
| 101.INS* | | XBRL Instance Document. |
| | | |
| 101.SCH* | | XBRL Taxonomy Extension Schema Document. |
| | | |
| 101.CAL* | | XBRL Taxonomy Extension Calculation Linkbase Document. |
| | | |
| 101.DEF* | | XBRL Taxonomy Extension Definition Linkbase Document. |
| | | |
| 101.LAB* | | XBRL Taxonomy Extension Label Linkbase Document. |
| | | |
| 101.PRE* | | XBRL Taxonomy Extension Presentation Linkbase Document. |
† Schedules and exhibits may have been omitted pursuant to Item 601(b)(2) of Regulation S-K.
*XBRL (Extensible Business Reporting Language) information is furnished and not filed for purposes of Sections 11 and 12 of the Securities Act of 1933 and Section 18 of the Securities Exchange Act of 1934.
Item 16. Form 10-K Summary
None.
SIGNATURES
Pursuant to the requirements of Section 13 or 15 (d) of the Securities Exchange Act of 1934, as amended, the Registrant has duly caused this report to be signed on its behalf by the undersigned, thereunto duly authorized:
|
| | | |
| DRIVE SHACK INC. |
| | |
| By: | /s/ Wesley R. Edens |
| Wesley R. Edens |
| Chairman of the Board |
| | |
| March 2, 2017 |
Pursuant to the requirements of the Securities Exchange Act of 1934, as amended, this report has been signed below by the following persons on behalf of the Registrant and in the capacities and on the dates indicated.
|
| | |
By: | /s/ Wesley R. Edens | |
Wesley R. Edens | |
Chairman of the Board | |
| | |
March 2, 2017 | |
| | |
By: | /s/ Sarah L. Watterson | |
Sarah L. Watterson | |
Chief Executive Officer and President |
| | |
March 2, 2017 | |
| | |
By: | /s/ Lawrence A. Goodfield, Jr. | |
Lawrence A. Goodfield, Jr. | |
Chief Financial Officer, Chief Accounting Officer and Treasurer |
| | |
March 2, 2017 | |
| | |
By: | /s/ Kenneth M. Riis | |
Kenneth M. Riis | |
Director |
| | |
March 2, 2017 | |
| | |
By: | /s/ Kevin J. Finnerty | |
Kevin J. Finnerty | |
Director | |
| | |
March 2, 2017 | |
| | |
By: | /s/ Stuart A. McFarland | |
Stuart A. McFarland | |
Director | |
| | |
March 2, 2017 | |
| | |
By: | /s/ David K. McKown | |
David K. McKown | |
Director | |
| | |
March 2, 2017 | |
| | |
By: | /s/ Alan L. Tyson | |
Alan L. Tyson | |
Director | |
| | |
March 2, 2017 | |
By: | /s/ Clifford Press | |
Clifford Press | |
Director | |
| |
March 2, 2017 | |
SPECIAL NOTE REGARDING EXHIBITS
In reviewing the agreements included as exhibits to this Annual Report on Form 10-K, please remember they are included to provide you with information regarding their terms and are not intended to provide any other factual or disclosure information about the Company or the other parties to the agreements. The agreements contain representations and warranties by each of the parties to the applicable agreement. These representations and warranties have been made solely for the benefit of the other parties to the applicable agreement and:
| |
• | should not in all instances be treated as categorical statements of fact, but rather as a way of allocating the risk tone of the parties if those statements prove to be inaccurate; |
| |
• | have been qualified by disclosures that were made to the other party in connection with the negotiation of the applicable agreement, which disclosures are not necessarily reflected in the agreement; |
| |
• | may apply standards of materiality in a way that is different from what may be viewed as material to you or other investors; and |
| |
• | were made only as of the date of the applicable agreement or such other date or dates as may be specified in the agreement and are subject to more recent developments. |
Accordingly, these representations and warranties may not describe the actual state of affairs as of the date they were made or at any other time. Additional information about the Company may be found elsewhere in this Annual Report on Form 10-K and the Company’s other public filings, which are available without charge through the SEC’s website at http://www.sec.gov. See “Business – Corporate Governance and Internet Address; Where Readers Can Find Additional Information.”
The Company acknowledges that, notwithstanding the inclusion of the foregoing cautionary statements, it is responsible for considering whether additional specific disclosures of material information regarding material contractual provisions are required to make the statements in this report not misleading.
Exhibit Index
|
| |
2.1 † | Separation and Distribution Agreement dated April 26, 2013, between New Residential Investment Corp. and the Registrant (incorporated by reference to the Registrant’s Quarterly Report on Form 10-Q, Exhibit 2.1, filed on May 3, 2013). |
| |
2.2 † | Separation and Distribution Agreement dated October 16, 2014, between New Senior Investment Group Inc. and the Registrant (incorporated by reference to the Registrant's Quarterly Report on Form 10-Q, Exhibit 3.2, filed on November 5, 2014). |
| |
3.1 | Articles of Restatement (incorporated by reference to the Registrant’s Report on Form 8-K, Exhibit 3.2, filed on December 8, 2016). |
| |
3.2 | Articles Supplementary relating to the Series B Preferred Stock (incorporated by reference to the Registrant’s Quarterly Report on Form 10-Q, Exhibit 3.3, filed on May 13, 2003). |
| |
3.3 | Articles Supplementary relating to the Series C Preferred Stock (incorporated by reference to the Registrant’s Report on Form 8-K, Exhibit 3.3, filed on October 25, 2005). |
| |
3.4 | Articles Supplementary relating to the Series D Preferred Stock (incorporated by reference to the Registrant’s Report on Form 8-A, Exhibit 3.1, filed on March 14, 2007). |
| |
3.5 | Articles Supplementary of Series E Junior Participating Preferred Stock dated December 8, 2016. |
| |
3.6 | Amended and Restated By-laws (incorporated by reference to the Registrant’s Report on Form 8-K, Exhibit 3.4, filed on December 8, 2016). |
| |
3.7 | Articles of Amendment (incorporated by reference to the Registrant's Report on Form 8-K, Exhibit 3.1, filed on August 19, 2014). |
| |
3.8 | Articles of Amendment (incorporated by reference to the Registrant's Report on Form 8-K, Exhibit 3.1, filed on October 22, 2014). |
| |
4.1 | Junior Subordinated Indenture between Newcastle Investment Corp. and The Bank of New York Mellon Trust Company, National Association, dated April 30, 2009 (incorporated by reference to the Registrant’s Report on Form 8-K, Exhibit 4.1, filed on May 4, 2009). |
| |
4.2 | Pledge and Security Agreement between Newcastle Investment Corp. and The Bank of New York Mellon Trust Company, National Association, as trustee, dated April 30, 2009 (incorporated by reference to the Registrant’s Report on Form 8-K, Exhibit 4.2, filed on May 4, 2009). |
| |
4.3 | Pledge, Security Agreement and Account Control Agreement among Newcastle Investment Corp., NIC TP LLC, as pledgor, and The Bank of New York Mellon Trust Company, National Association, as bank and trustee, dated April 30, 2009 (incorporated by reference to the Registrant’s Report on Form 8-K, Exhibit 4.3, filed on May 4, 2009). |
| |
4.4 | Tax Benefits Preservation Plan, dated as of December 7, 2016, between Newcastle Investment Corp. and American Stock Transfer & Trust Company, LLC (incorporated by reference to the Registrant’s Report on Form 8-K, Exhibit 4.1, filed on December 8, 2016). |
| |
10.1 | Amended and Restated Management and Advisory Agreement by and among the Registrant and FIG LLC, dated January 1, 2017. |
| |
10.2 | 2012 Newcastle Investment Corp. Nonqualified Stock Option and Incentive Award Plan, adopted as of May 7, 2012 (incorporated by reference to the Registrant’s Report on Form 10-K, Exhibit 10.3, filed on February 28, 2013). |
| |
10.3 | Amended and Restated 2014 Newcastle Investment Corp. Nonqualified Stock Option and Incentive Award Plan, adopted as of November 3, 2014 (incorporated by reference to the Registrant's Report on Form 10-K, Exhibit 10.5, filed on March 2, 2015). |
| |
10.4 | 2015 Newcastle Investment Corp. Nonqualified Option and Incentive Award Plan, adopted as of April 16, 2015 (incorporated by reference to Annex A of the Registrant's definitive proxy statement for the 2015 annual meeting of stockholders filed on April 17, 2015). |
|
| |
| |
10.5 | 2016 Newcastle Investment Corp. Nonqualified Option and Incentive Award Plan (incorporated by reference to the Registrant's Report on Form 8-K, Exhibit 10.1 filed on May 19, 2016). |
| |
10.6 | Exchange Agreement between Newcastle Investment Corp. and Taberna Preferred Funding IV, Ltd., Taberna Preferred Funding V, Ltd., Taberna Preferred Funding VI, Ltd. And Taberna Preferred Funding VII, Ltd., dated April 30, 2009 (incorporated by reference to the Registrant’s Report on Form 8-K, Exhibit 10.1, filed on May 4, 2009). |
| |
10.7 | Exchange Agreement, dated as of January 29, 2010, by and among Newcastle Investment Corp., Taberna Capital Management, LLC, Taberna Preferred Funding IV, Ltd., Taberna Preferred Funding V, Ltd., Taberna Preferred Funding VI, Ltd. And Taberna Preferred Funding VII, Ltd. (incorporated by reference to the Registrant’s Report on Form 8-K, Exhibit 10.1, filed on February 2, 2010). |
| |
10.8 | Sale and Cooperation Agreement, dated September 7, 2012, among Newcastle Investment Corp., Barclays Bank PLC and ED LIMITED (incorporated by reference to the Registrant’s Report on Form 10-Q, Exhibit 10.33, filed on October 26, 2012). |
| |
10.9 | Form of Indemnification Agreement (incorporated by reference to the Registrant's Report on Form 10-Q, Exhibit 10.19, filed on August 8, 2014). |
| |
12.1 | Statements re: Computation of Ratios. |
| |
21.1 | Subsidiaries of the Registrant. |
| |
23.1 | Consent of Ernst & Young LLP, independent registered public accounting firm. |
| |
31.1 | Certification of Chief Executive Officer as adopted pursuant to Section 302 of the Sarbanes-Oxley Act of 2002. |
| |
31.2 | Certification of Chief Financial Officer as adopted pursuant to Section 302 of the Sarbanes-Oxley Act of 2002. |
| |
32.1 | Certification of Chief Executive Officer pursuant to 18 U.S.C. Section 1350, as adopted pursuant to Section 906 of the Sarbanes-Oxley Act of 2002. |
| |
32.2 | Certification of Chief Financial Officer pursuant to 18 U.S.C. Section 1350, as adopted pursuant to Section 906 of the Sarbanes-Oxley Act of 2002. |
| |
101.INS* | XBRL Instance Document. |
| |
101.SCH* | XBRL Taxonomy Extension Schema Document. |
| |
101.CAL* | XBRL Taxonomy Extension Calculation Linkbase Document. |
| |
101.DEF* | XBRL Taxonomy Extension Definition Linkbase Document. |
| |
101.LAB* | XBRL Taxonomy Extension Label Linkbase Document. |
| |
101.PRE* | XBRL Taxonomy Extension Presentation Linkbase Document. |
† Schedules and exhibits may have been omitted pursuant to Item 601(b)(2) of Regulation S-K.
*XBRL (Extensible Business Reporting Language) information is furnished and not filed for purposes of Sections 11 and 12 of the Securities Act of 1933 and Section 18 of the Securities Exchange Act of 1934.