 Newcastle Investment Corp.
Investor Presentation
January 7, 2013
Issuer Free Writing Prospectus
Dated January 7, 2013
Filed Pursuant to Rule 433
Registration Statement No. 333-182103 |
 Newcastle Investment Corp.
Investor Presentation
January 7, 2013
Issuer Free Writing Prospectus
Dated January 7, 2013
Filed Pursuant to Rule 433
Registration Statement No. 333-182103 |
 Disclaimer and Notes
1
forward-looking statements relate to, among other things, the
operating performance of our investments, the completion of certain pending Excess MSR transactions, the proposed spin-off of
our residential business, the stability of our earnings, our financing
needs, potential investments, estimated investment returns and assumptions underlying those returns (including, but not
limited to, recapture rates, prepayments rates, default rates),
projected dividend growth, projected dividend yields and interest rate changes. Forward-looking statements are generally
identifiable by use of forward-looking terminology such as
"may," "will," "should," "potential," "intend," "expect," "endeavor," "seek," "anticipate," "estimate," "overestimate," "underestimate,"
"believe," "could," "project,"
"predict," "continue,“ “target” or other similar words or expressions. Forward-looking statements are based on certain assumptions, discuss future expectations,
describe future plans and strategies, contain projections of results
of operations or of financial condition or state other forward-looking information. Our ability to predict results or the actual
outcome of future plans or strategies is inherently uncertain.
Although we believe that the expectations reflected in such forward-looking statements are based on reasonable assumptions, our
actual results and performance could differ materially from those set
forth in the forward-looking statements. These forward-looking statements involve risks, uncertainties and other factors
that may cause our actual results in future periods to differ
materially from forecasted results. Factors which could have a material adverse effect on our operations and future prospects
include, but are not limited to: reductions in cash flows received
from our investments; our ability to take advantage of opportunities in additional asset classes or types of assets, at attractive
risk-adjusted prices; our ability to leverage our RMBS portfolio,
our ability to collapse RMBS portfolios and CDOs, our ability to recover cash flows from our CDOs, our ability to take
advantage of opportunities in investments in excess mortgage
servicing rights; our ability to deploy capital accretively; the risks that prepayment, default and recovery rates on our real estate
securities and loan portfolios deteriorate compared to our
underwriting estimates; the relationship between yields on assets which are paid off and yields on assets in which such monies can be
reinvested; the relative spreads between the yield on the assets we
invest in and the cost of financing; changes in economic and market conditions generally and the real estate and bond
markets specifically; adverse changes in the financing markets we
access affecting our ability to finance our investments, or in a manner that maintains our historic net spreads; changing risk
assessments by lenders that potentially lead to increased margin
calls, not extending our repurchase agreements or other financings in accordance with their current terms or entering into new
financings with us; changes in interest rates and/or credit spreads,
as well as the success of any hedging strategy we may undertake in relation to such changes; the quality and size of the
investment pipeline and the rate at which we can invest our cash,
including cash inside our collateralized debt obligations, or CDOs; changes in the fair value of our excess servicing assets, our
dependence on mortgage servicers to service the mortgages underlying
our excess servicing assets, our ability to grow senior housing, GSE initiatives and other actions that may adversely
affect returns on our excess servicing assets; impairments in the
value of the collateral underlying our investments and the relation of any such impairments to our judgments as to whether
changes in the market value of our securities, loans or real estate
are temporary or not and whether circumstances bearing on the value of such assets warrant changes in carrying values;
legislative/regulatory changes, including, but not limited to, any
modification of the terms of loans; the availability and cost of capital for future investments; competition within the finance and
real estate industries; and other risks detailed from time to time in
our Securities and Exchange Commission reports. Readers are cautioned not to place undue reliance on any of these forward-
looking statements, which reflect our management's views as of the
date of this Presentation significantly from those contained in any forward-looking statement. Although we believe that the
expectations reflected in the forward-looking statements are
reasonable, we cannot guarantee future results, levels of activity, performance or achievements. We are under no duty to update
any of the forward-looking statements after the date of this
Presentation to conform these statements to actual results.
be earned over the expected average life of an investment (i.e.,
IRR), after giving effect to existing or anticipated leverage (if any), calculated on a weighted average basis, projected market
conditions and various other factors. Income recognized by the
Company in future periods may be significantly less than the income that would have been recognized if an expected or
targeted return were actually realized, and the estimates we use to
calculate expected or targeted returns would differ materially from actual results. Statements about expected or targeted
returns in this Presentation are forward-looking statements. You
should carefully read the cautionary statement above under the caption “Forward-Looking Statements,” which directly applies
to our discussion of expected or targeted returns. Actual
returns may differ materially from expected or targeted returns.
relied upon as the basis for making an investment decision.
Before you invest, you should
read the prospectus in that registration statement and other documents the Company has filed with the SEC for more complete information about the Company
and this offering. You may get these documents for free by visiting
EDGAR on the SEC Web site at: www.sec.gov. Alternatively, the Company, any underwriter or any dealer participating in
the offering will arrange to send you the prospectus if you request
it by calling Credit Suisse Securities (USA) LLC toll-free at (800) 221-1037, Barclays Capital Inc. toll-free at (888) 603-5847,
Citigroup toll-free at (800) 831-9146 or UBS Securities LLC
toll-free at (888) 827-7275.
This disclaimer applies to this document and the oral comments made by
the individuals presenting it (the “Presentation”).
Forward
–
Looking
Statements:
This
Presentation
contains
certain
"forward-looking
statements"
within
the
meaning
of
the
Private
Securities
Litigation
Reform
Act
of
1995.
Such
Expected
or
Targeted
Returns:
Expected
or
targeted
returns
are
estimates
of
the
Company
of
annualized
effective
rate
of
return
that
the
Company
presently
expects
or
targets
to
Past
performance:
In
all
cases
where
historical
performance
is
presented,
please
note
that
past
performance
is
not
a
reliable
indicator
of
future
results
and
should
not
be
Newcastle
Investment
Corp.
("Newcastle")
has
filed
a
registration
statement
(including
a
prospectus)
with
the
SEC
for
the
offering
to
which
this
communication
relates. |
 Disclaimer and Notes –
Continued
2
30+ DQ – Percentage of loans that are delinquent by 30 days or
more Age (mths) or Loan Age (mths) or Seasoning (mths) – Weighted
average number of months loans are outstanding
Avg. Balance – Average loan balance remaining Cash Basis – Initial investment less cash received life to
date CLTV – Combined Loan-to-Value CPR – Constant Prepayment Rate Current LTV – Ratio of current loan balance to estimated current
asset value Cur UPB – UPB as of the end of the current month Excess MSRs – monthly interest payments generated by the MSRs,
net of a basic fee paid to the servicer
Orig. FICO – A borrower’s credit metric generated by the
credit scoring model created by the Fair Isaac Corporation at the time of purchase
LTD Cash Flows –Actual cash flow collected from the investment
as of the end of the current month
Orig. UPB – UPB as of the investment’s acquisition
date Proj. Future Cash Flows – Future cash flow projected with the
Company’s original underwriting assumptions
Recapture Rate – Percentage of fully prepaid loans that are
refinanced by Nationstar and will be put back into the pool
Uncollected Payments – Percentage of loans that missed their
most recent payment UPB – Unpaid Principal Balance Updated IRR – Internal rate of return calculated based on the
cash flow received to date through the current month and the projected future cash flow based on our original
underwriting assumptions. WA – Weighted Average WAL – Weighted Average Life WAC – Weighted Average Coupon
Abbreviations:
This Presentation may include abbreviations, which have the
following meanings: No reliance, no update and use of
information: You should not exclusively rely on the
Presentation as the basis upon which to make an investment decision. The Presentation does not
purport to be complete without consideration of the information in the
prospectus. The information in the Presentation is provided to you as of the dates indicated and Newcastle
does not intend to update the information after its distribution, even
in the event that the information becomes materially inaccurate. Certain information contained in the
Presentation includes calculations or figures that have been prepared
internally and have not been audited or verified by a third party. Use of different methods for preparing,
calculating or presenting information may lead to different results
and such differences may be material.
|
 Executive Summary
We
believe
our
residential
business
line
has
reached
a
"critical
mass"
We expect separation of residential and commercial business lines
will unlock value for stockholders Transaction
1
–
We
committed
to
invest
approximately
$340
million
(1)
for
a
33%
interest
in
Excess
MSRs
on
four
loan
pools,
approximately
$215
billion
UPB
(2)
Transaction 2 –
On January 4, 2013, we invested $27 million for a 33% interest in
Excess MSRs on a $13 billion UPB pool of Ginnie Mae
loans We intend to publicly offer 40 million shares of common
stock 1)
We expect to invest $320 million based on expected UPB at expected
time of close. Targeted returns and cash flows assume this investment amount.
2)
UPB as of November 30, 2012.
3
3
2
1
Newcastle to spin off certain residential assets – establish New
Residential Investment Corp.
Announcement of two new Excess MSR investments – over $225 billion
UPB |
 Spin-Off of Residential Assets
4
1 |
 Overview of Spin-Off
Newcastle is currently housing a commercial business and a residential
business, each with significant growth potential
Spin-off will create a residential-focused mortgage REIT
(“New Residential”) Target assets include Excess
MSRs, RMBS, Non-Performing Loans, Servicing Advances
Fortress-managed –
substantially similar terms to Newcastle’s management
agreement NYSE listing expected
Potential dividend yield tightening relative to Newcastle’s
average 2012 dividend yield at 12% Spin-off approved by
Board of Directors Filed Form 10 with the SEC
Next Steps:
Complete SEC review and NYSE listing processes
Target distribution of New Residential shares in the first quarter
of 2013 5
1)
The spin-off may not have the full or any of the strategic and
financial benefits that we expect, or such benefits may be delayed or may not materialize at all.
2)
Distribution ratio is subject to change. The spin-off is
subject to certain conditions, such as the Securities and Exchange Commission (“SEC”) declaring the registration
statement relating to the spin-off effective, the filing and
approval of an application to list New Residential’s common stock on the NYSE, and the formal declaration of the
distribution by our Board of Directors. Expected
to
improve
transparency
and
unlock
shareholder
value
(1)
Plan
to
distribute
one
share
of
New
Residential
for
each
share
of
Newcastle
common
stock
(2) |
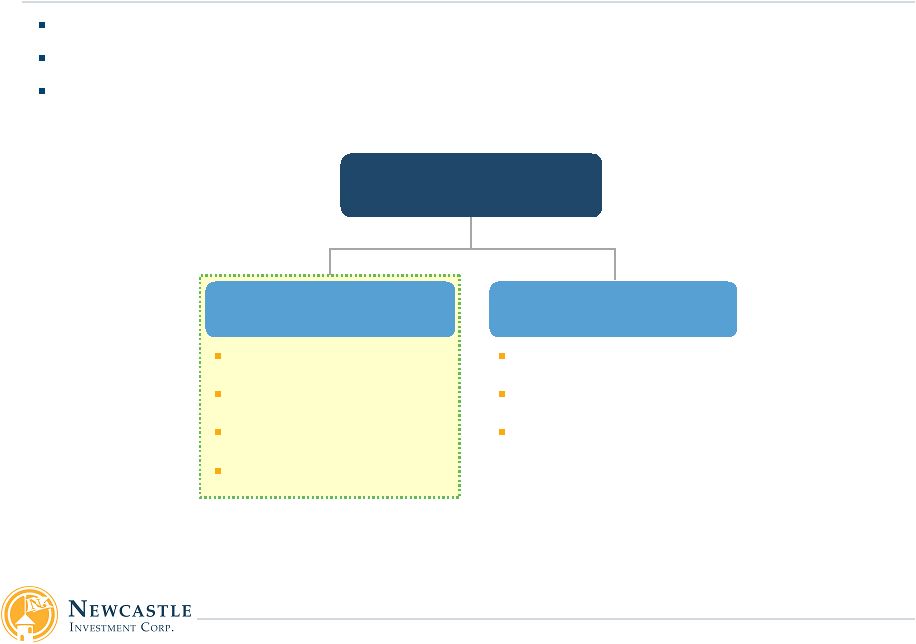 Separating the Two Businesses
We believe separating the two businesses will improve transparency and
unlock shareholder value With the new acquisitions, we anticipate
each business will be sizable enough to stand alone We
expect a significant investment pipeline for each business
1)
Investments other than the types highlighted may be made at the
Manager’s discretion as consistent with the company’s investment guidelines.
6
Post-Spin Newcastle
Target Assets
(1)
New Residential
Target Assets
(1)
Excess MSRs
RMBS
Non-Performing Loans
Servicing Advances
Newcastle
SPIN-OFF
Newcastle CDOs
Commercial RE Debt
Senior Housing |
 Targeted Economics of Our Two Businesses*
* Please refer to the following page for explanatory notes and
specific disclaimers related to the information presented on this page.
7
Excess MSRs
(2)
$258 mm
New
Excess
MSR
Transactions
(3)
$350 mm
Non-Agency RMBS
(4)
$200 mm
Less: Repo Debt
($60) mm
Investable Cash
(5)
$92 mm
Total
Residential
Value
(9)
$840 mm
Real
Estate
Debt
(6)
$725 mm
Senior Housing
(7)
$65 mm
Less:
Corporate
Debt
(8)
($112) mm
Investable Cash
(5)
$92 mm
Total
Commercial
Value
(9)
$770 mm
New Residential
(1)
Newcastle Post-Spin
Assumed
Dividend
Yield
(13)
7%
8%
9%
10%
Implied price / share:
$7.71
$6.75
$6.00
$5.40
Implied Market Cap.
$1.6bn
$1.4bn
$1.3bn
$1.1bn
Assumed Dividend Yield
(13)
7%
8%
9%
10%
Implied price / share:
$7.14
$6.25
$5.56
$5.00
Implied Market Cap.
$1.5bn
$1.3bn
$1.2bn
$1.1bn
Targeted
Net
IRR
(10)
14%
$115 mm
(11)
Per share
(12)
$0.54
Targeted
Net
IRR
(10)
14%
$106 mm
(11)
Per Share
(12)
$0.50 |
 1)
Newcastle’s ability to complete a spin-off of New Residential
is subject to certain conditions, such as the SEC declaring the registration statement
relating to the spin-off effective, the filing and approval of an
application to list New Residential’s common stock on the NYSE, and the formal
declaration of the distribution by our Board of Directors. 2)
Reflects carrying value as of September 30, 2012 of $258
million.
3)
Reflects pro forma adjustments for $320 million expected investment
in Excess MSR Transaction 1 and $27 million investment in Excess MSR
Transaction 2.
4)
Reflects the carrying value as of September 30, 2012. 5) Investable cash for
each of New Residential and Newcastle post-spin reflect half of Newcastle’s total investable cash as of September 30, 2012 of
$184 million. The allocation of the September 30, 2012 cash balance
is for illustrative purposes only. Actual cash balance may differ materially.
6)
Reflects an unaudited estimate of expected future recovery value of
the principal as of September 30, 2012. This amount reflects a variety of
assumptions, and actual recovery value may differ materially from the
current estimate.
7)
Reflects net investment in senior housing as of September 30, 2012,
including working capital and related transaction costs.
8)
Reflects face amount of the junior subordinated notes and preferred
equity as of September 30, 2012.
9)
Does not reflect all of the assets New Residential and Newcastle will
own post-spin. Each of New Residential and Newcastle intend to own
other assets, including Agency RMBS, which could affect the total
value of each business.
10)
Targeted Net IRR may differ materially from actual returns. Targeted
Net IRRs indicated are based on a variety of assumptions and estimates,
including assumptions with respect to gross investment returns,
attainable leverage and estimates of corporate overhead expenses, which will
differ for each business. Net IRR will also be affected by the
matters identified in the prospectus supplement under “Risk Factors.” Following
the spin-off, corporate overhead expenses of Newcastle and New
Residential are expected to increase on an aggregate basis as a result of
management compensation and general and administrative expenses
payable by New Residential.
11)
Represents the product of Targeted Net IRR and Total Residential
Value or Total Commercial Value, as applicable. Slight inaccuracies are due to
rounding.
12)
Assumes completion of the proposed equity offering described herein
and the distribution of one share of New Residential for each share of
Newcastle, which may change prior to the distribution. Implied share
price does not reflect Newcastle’s expectation of the price at which it may
offer shares. Per share amount does not reflect potential dilution
from outstanding options for shares of Newcastle common stock and options
that Newcastle expects to issue for shares of New Residential.
Such dilution could be material.
13)
Dividend yields presented are for illustrative purposes only. Actual
dividends may differ materially. Corresponding price per share assumes
100% payout of stated per share amount. Targeted
Economics of Our Two Businesses – Explanatory Notes
8 |
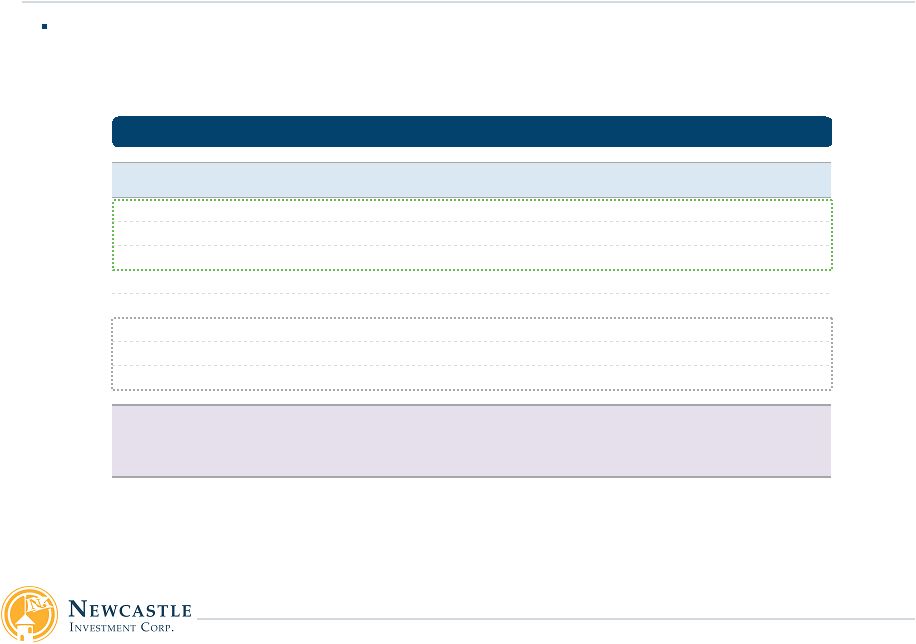 New Residential –
Potential Dividend Yield Tightening
1)
Source: SNL Financial. Stock Price as of 1/4/2013,
dividend yield based on last declared regular dividend.
2)
Portfolio composition from recent 3Q 2012 filings and presentations.
Peer group is a non-exhaustive list and inclusion of others may change minimum, maximum and average.
3)
Determination of comparability of subsets has been made by
management. Other industry participants may express a different view.
9
Dividend
Yield
Market
Cap ($mm)
Portfolio Composition
Redwood
5.6%
$1,467
Non-Agency MBS, Residential loans, Commercial loans (15%)
HLSS
7.4%
$1,081
MSRs (10%), Servicing Advances (90%)
PennyMac Mortgage Inv.
8.8%
$1,521
Distressed Mortgage Loans, MSRs
MFA Financial
9.3%
$3,061
Agency MBS (60%), Non-Agency MBS (40%)
Dynex Capital Inc.
11.8%
$535
Agency MBS (64%), CMBS (32%)
Invesco Mortgage Capital
12.3%
$2,456
Agency MBS (76%), Non-Agency MBS (14%), CMBS (10%)
AG Mortgage Inv. Trust
13.2%
$654
Agency MBS (80%), Non-Agency MBS (16%)
Two Harbors Inv. Corp.
18.8%
$3,462
Agency MBS (84%), Non-Agency MBS (16%)
Minimum
5.6%
$535
Average
10.9%
$1,780
Maximum
18.8%
$3,462
Less
comparable
subset
(3)
More
comparable
subset
(3)
Public
Residential
Mortgage
REITs
(1,2)
Residential peers with comparable portfolios trade at a 6 – 9%
yield, vs. Newcastle 2012 average at 12% |
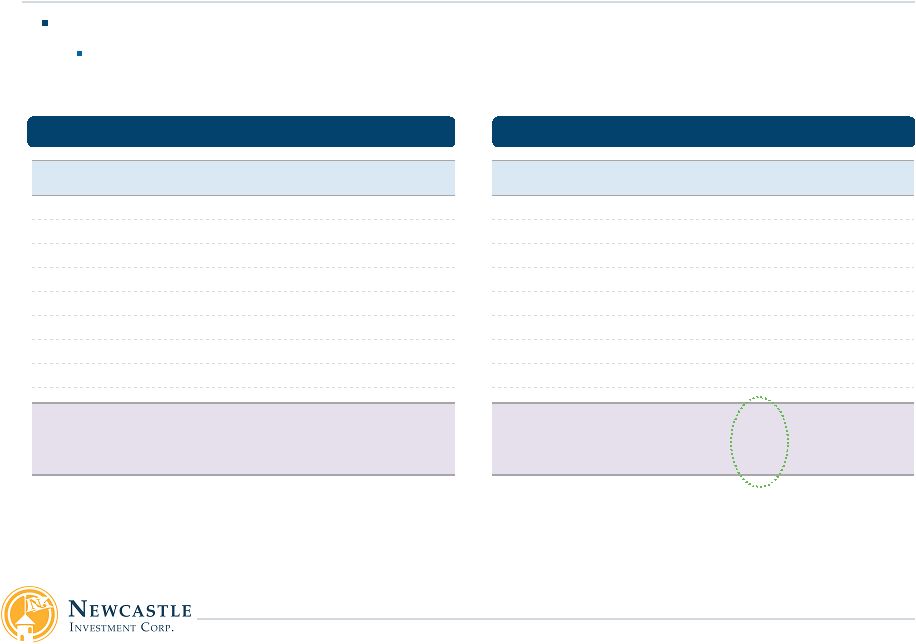 Newcastle
–
Potential Dividend Yield Tightening
Based on comparable peers, potential dividend yield tightening could
take place at Newcastle as well As senior housing portfolio
grows, further tightening expected toward range of public healthcare REITs
10
Dividend
Yield
Market Cap
($mm)
Arbor Realty Trust
6.7%
$205
RAIT Financial Trust
6.8%
$345
Colony Financial
7.0%
$1,056
Starwood Property Trust
7.4%
$3,224
NorthStar
9.2%
$1,206
Apollo Commercial RE
9.4%
$476
CreXus Investment Corp
10.3%
$955
Resource Capital
13.4%
$599
Minimum
6.7%
$205
Average
8.8%
$1,008
Maximum
13.4%
$3,224
Public
Healthcare
REITs
(1,2)
Dividend
Yield
Market Cap
($mm)
Ventas Inc.
3.8%
$19,205
HCP Inc.
4.4%
$20,735
National Health Investors
4.6%
$1,636
Health Care REIT Inc.
4.8%
$16,030
Healthcare Realty Trust
4.8%
$2,177
LTC Properties Inc.
5.1%
$1,108
Senior Housing Properties
6.4%
$4,303
Medical Properties Trust
6.5%
$1,678
Minimum
3.8%
$1,108
Average
5.0%
$8,359
Maximum
6.5%
$20,735
Public
Commercial
Finance
REITs
(1,2)
Additional yield tightening
expected as senior housing
portfolio grows
(3)
1) Source: SNL Financial. Stock Price as of 1/4/2013, dividend yield based on last declared regular dividend.
2) Peer group is a non-exhaustive list and inclusion of others
may change minimum, maximum and average.
3) The ability to grow the senior housing portfolio is subject to a number of factors and may not occur. Please see “Forward
Looking Statements.” |
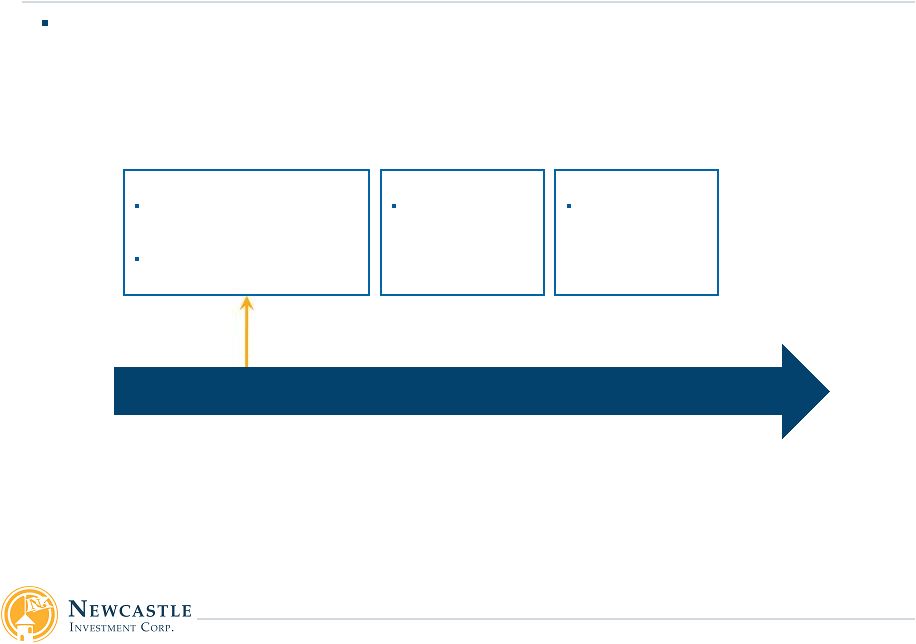 Anticipated Separation Timing
We
intend
to
distribute
shares
of
New
Residential
in
the
first
quarter
of
2013
(1)
11
Announcement of board
approval of spin-off
Filed Form 10 with the SEC
Jan ‘13
Jan ‘13
Intend to distribute
shares of New
Residential
Feb ‘13
Feb ‘13
Mar ‘13
Mar ‘13
Expect to complete
SEC review &
NYSE listing
processes
1) There can be no assurance that the spin-off of New Residential
will be completed as anticipated or at all. The spin-off is subject to certain conditions, such as the SEC
declaring the registration statement relating to the
spin-off effective, the filing and approval of an application to list New Residential’s common stock on the NYSE, and the
formal declaration of the distribution by our Board of Directors.
|
 12
Two New Excess MSR Transactions
2 |
 Investment Highlights
Transaction
1
–
Approximately
$215
billion
UPB
(1)
We
committed
to
invest
approximately
$340
million
(2)
to
acquire
a
33%
interest
in
Excess
MSRs
In
our
base
case,
we
target
a
16%
unleveraged
IRR,
2.0x
investment
multiple
and
a
break-even
CPR
of
54%
(3)
Four loan pools: 47% Agency/Government loans and 53% PLS
loans Transaction
2
–
$13
billion
UPB
On January 4, 2013, we invested $27 million to acquire a 33%
interest in Excess MSRs on a pool of Ginnie Mae loans
In
our
base
case,
we
target
a
16%
unleveraged
IRR,
2.1x
investment
multiple
and
a
break-even
CPR
of
55%
(3)
1)
UPB as of November 30, 2012.
2)
Expect to invest $320 million based on expected UPB at time of
close. Targeted returns and cash flows assume this investment amount.
3)
Based upon various assumptions of management, including prepayment,
recapture and default rates. Actual results may differ materially.
4)
Represents Newcastle’s 33% interest in the Excess MSR.
13
UPB
NCT
Total
MSR
Basic
Fee
Excess
MSR
Avg.
Balance
WAC
Seasoning
Current
LTV
Orig.
FICO
30+
DQ
Transaction 1
$215bn
(1)
$340 mm
(2)
33 bps
19 bps
14 bps
$159k
5.32%
5.9 yrs
101%
704
27%
Transaction 2
$13 bn
$27 mm
40 bps
15 bps
25 bps
$149k
5.64%
3.6 yrs
101%
674
16%
TOTAL / WA
$228 bn
$367 mm
33 bps
19 bps
14 bps
$158k
5.34%
5.8 yrs
101%
702
26%
Collateral Characteristics
Commitment
(4) |
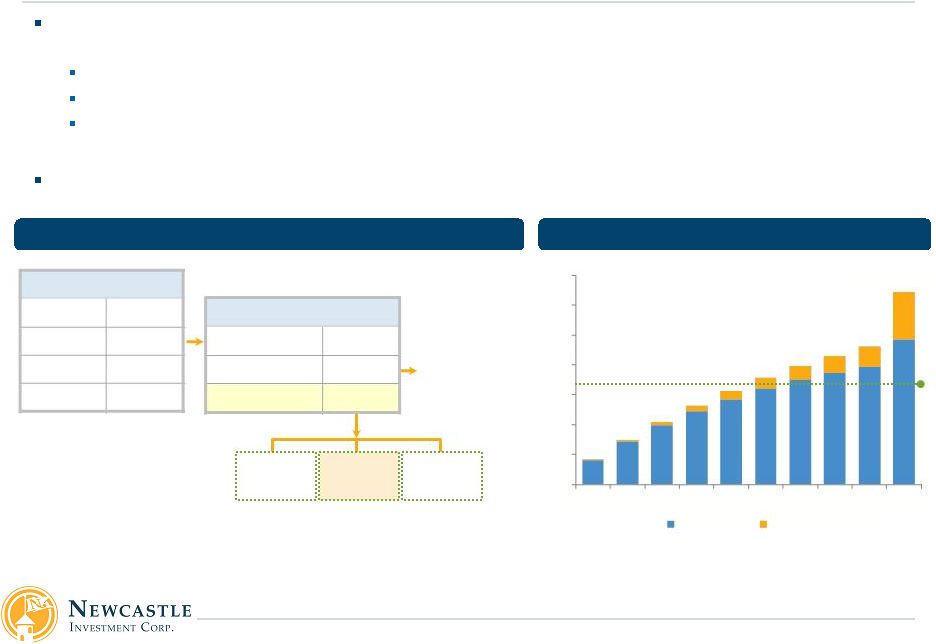 Transaction 1 –
Overview
(1)
Newcastle
committed
to
invest
approximately
$340
million
(2)
for
a
33%
interest
in
the
Excess
MSRs
on
four
Agency/Government
and
Private
Label
pools
that
total
approximately
$215
billion
UPB
(3,4)
Nationstar
will
service
the
loans
–
paid
a
19
bps
basic
fee
and
will
receive
all
originations
and
ancillary
income
Nationstar and a Fortress Fund will each own a 33% interest in the
Excess MSRs on the same terms as Newcastle Newcastle will not
have servicing duties or advance obligations associated with the pools
Newcastle
targets
receipt
of
$635
million
of
total
cash
flows
vs.
$320
million
expected
investment
(2)
1)
Based upon various assumptions of management, including prepayment,
recapture and default rates. Actual results may differ materially.
2)
Expect to invest $320 million based on expected UPB at time of close.
Targeted returns and cash flows assume this investment amount.
3)
UPB as of November 30, 2012.
4)
Investment is subject to closing conditions and third party
approvals. 14
Structure
Targeted NCT Cumulative Cash Flows
Paid to Nationstar
(Loan Servicer)
(mm)
Expected
Investment
of
$320
mm
(2)
Targeted Break-even of 5.3 yrs
33%
Fortress
Fund
33%
Newcastle
33%
Nationstar
MSR Breakdown
Total MSR
33 bps
Basic
Fee
(19 bps)
Excess MSR
14bps
Transaction
1
UPB
$215 bn
(3)
Total MSR
33 bps
WAC
5.3%
Seasoning
5.9yrs
$635 mm
$0
$100
$200
$300
$400
$500
$600
$700
Yr 1
Yr 2
Yr 3
Yr 4
Yr 5
Yr 6
Yr 7
Yr 8
Yr 9
Yr 10+
Original Pool
Recaptured Pool |
 CPR
5%
10%
15%
20%
25%
IRR
21.3%
17.7%
15.5%
12.6%
10.1%
Cash Flows
$868.0
$721.8
$635.2
$568.1
$510.3
Investment Multiple
2.72x
2.26x
1.99x
1.78x
1.60x
CPR
5%
10%
15%
20%
25%
IRR
19.5%
14.4%
10.4%
5.1%
3.7%
Cash Flows
$786.7
$592.4
$488.2
$389.3
$319.0
Transaction 1 –
Newcastle Targeted Returns
15
CPR
5%
10%
15%
20%
25%
IRR
22.2%
19.4%
17.7%
15.6%
13.8%
Cash Flows
$912.0
$789.4
$729.5
$662.8
$613.0
0% Recapture
28% Recapture (Base Case)
45% Recapture
(Cash Flows: $mm)
Recapture
mitigates
prepayment
risk
1)
Actual results may differ materially from base case returns. Base
case numbers reflect a weighted average of four discrete pools each with their own set of default, delinquency,
prepayment and recapture assumptions. Weighted average Recapture Rate
of 28%, which depending on the pool ranges from 20% to 35%. Weighted average CPR of 15% (CPR ramp
assumes 21% for Year 1, 19% for Year 2). Weighted average lifetime
uncollected payment for Agency/Government loans of 8% (Uncollected payment 10% for Year 1 , 9% for Year 2).
Recaptured loans assume 10 CPR (8 CRR; 2 CDR); 28% Recapture, which
depending on the pool ranges from 20% to 35%.
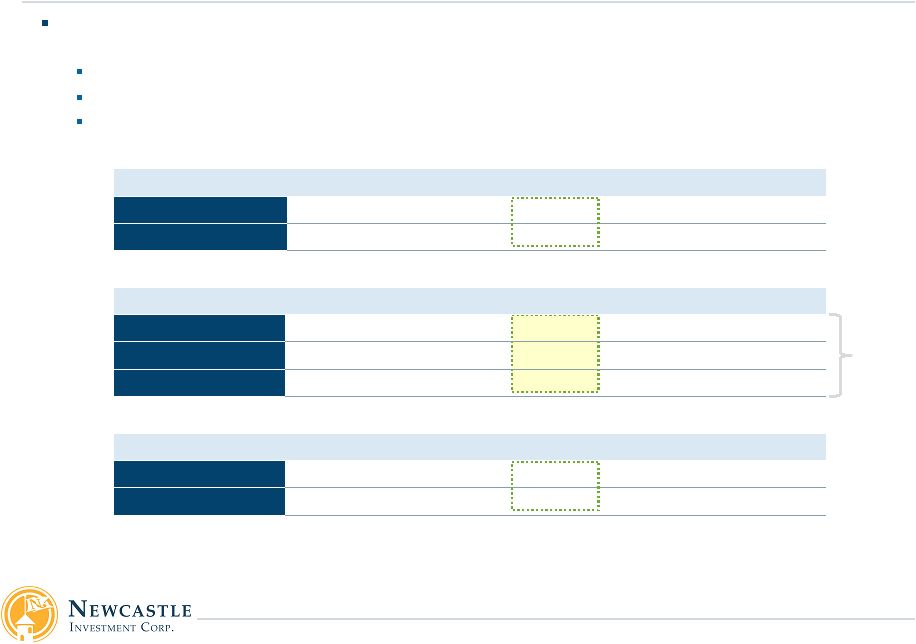
We
target
a
base
case
return
of
15.5%
unleveraged
IRR,
$635
million
of
cashflows
and
a
2.0x
investment
multiple
–
assumes
15%
CPR
and
28%
recapture
rate
(1)
Loans
from
the
pools
refinanced
by
Nationstar
will
remain
within
the
pools
post
refinance
As recapture percentage increases, yield profile becomes less
sensitive to changes in prepayments In our base case, we
target a break-even CPR of 54% |
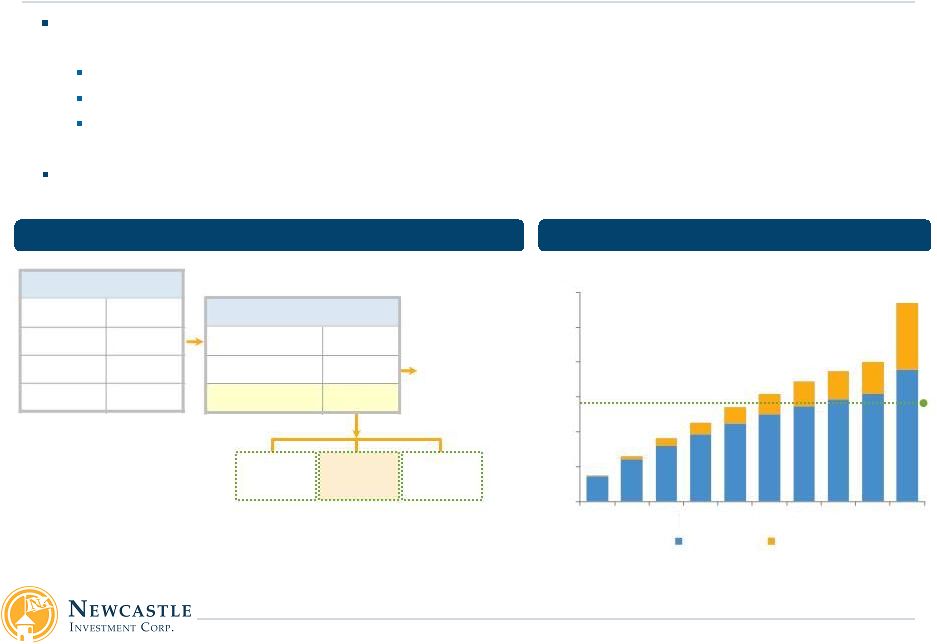 Nationstar
services
the
loans
–
paid
a
15
bps
basic
fee
and
receives
all
originations
and
ancillary
income
Nationstar and a Fortress Fund each own a 33% interest in the Excess
MSRs on the same terms as Newcastle Newcastle does not have
servicing duties or advance obligations associated with the pools
Transaction 2 –
Overview
(1)
1)
Based upon various assumptions of management, including prepayment,
recapture and default rates. Actual results may differ materially.
16
Structure
Targeted NCT Cumulative Cash Flows
Paid to Nationstar
(Loan Servicer)
(mm)
Initial Investment of $27 mm
Targeted Break-even of 5.1 yrs
MSR Breakdown
Total MSR
40 bps
Basic
Fee
(15 bps)
Excess MSR
25 bps
Transaction
2
UPB
$13 bn
Total MSR
40 bps
WAC
5.6%
Seasoning
3.6 yrs
33%
Nationstar
33%
Fortress
Fund
33%
Newcastle
$57 mm
$0
$10
$20
$30
$40
$50
$60
Yr 1
Yr 2
Yr 3
Yr 4
Yr 5
Yr 6
Yr 7
Yr 8
Yr 9
Yr 10+
Original Pool
Recaptured Pool
Newcastle targets receipt of $57 million of total cash flows vs. $27
million initial investment
On January 4, 2013, Newcastle invested $27 million for a 33%
interest in the Excess MSRs on a $13 billion UPB Ginnie Mae pool
of loans |
 CPR
10%
15%
20%
25%
30%
IRR
17.5%
12.4%
7.9%
3.4%
-1.2%
Cash Flows
$65.3
$47.7
$37.8
$31.0
$26.2
CPR
10%
15%
20%
25%
30%
IRR
21.1%
18.1%
15.8%
13.7%
12.0%
Cash Flows
$78.0
$64.9
$57.0
$51.4
$47.3
Investment Multiple
2.86x
2.38x
2.09x
1.89x
1.74x
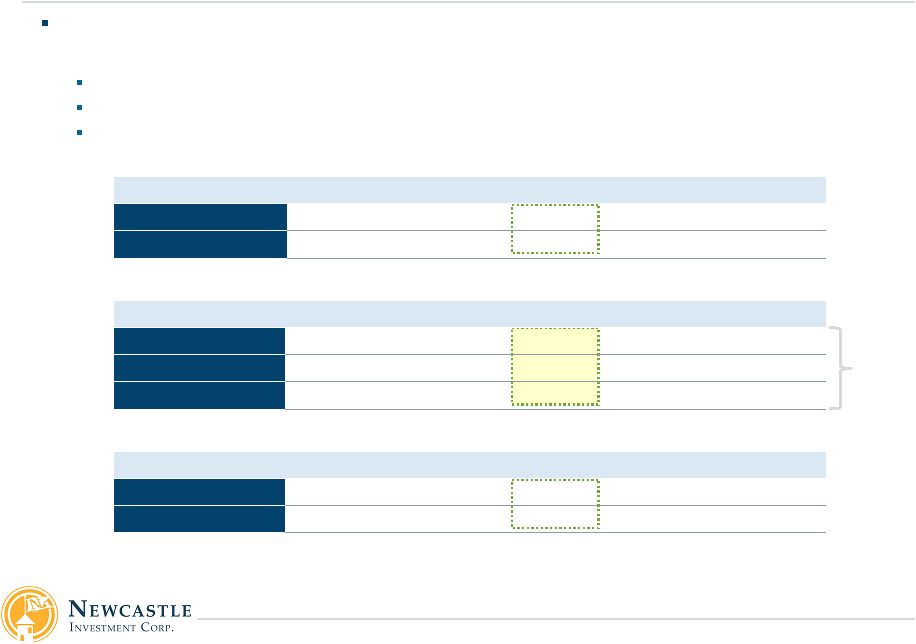
We target a base case return of 15.8% unleveraged IRR, $57 million of
cashflows and a 2.1x Loans
from
the
pools
refinanced
by
Nationstar
will
remain
within
the
pools
post
refinance
As recapture percentage increases, yield profile becomes less
sensitive to changes in prepayments In our base case, we
target a break-even CPR of 55% Transaction 2 –
Newcastle Targeted Returns
1)
Actual results may differ materially from base case returns.
Recapture ramp assumes 0% for 2 months after transfer date, 17% in month 3, and 35% thereafter. CPR ramp
assumes 30% to Dec 2014, 15% thereafter. Weighted average lifetime
uncollected payment of 10% (Uncollected payment 11% for Year 1 , 11% for Year 2). Recaptured loans
assume 10 CPR (8 CRR; 2 CDR); 35% Recapture; 25 yr loan term; 37.5
bps MSR; 4.00% WAC. 17
CPR
10%
15%
20%
25%
30%
IRR
22.6%
20.3%
18.5%
17.0%
15.6%
Cash Flows
$83.5
$72.3
$65.3
$60.2
$56.4
0% Recapture
35% Recapture (Base Case)
50% Recapture
(Cash Flows: $mm)
Recapture
mitigates
prepayment
risk
investment
multiple
–
assumes
20%
CPR
and
35%
recapture
rate
(1) |
 18
Public Offering of Common Stock
3 |
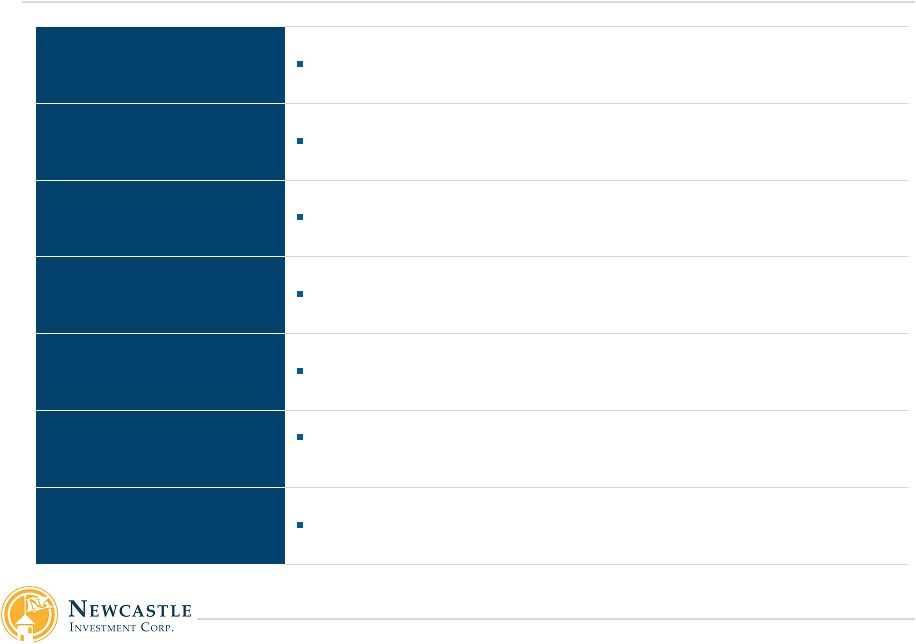 Offering Summary
Issuer
Newcastle Investment Corp.
Exchange / Ticker
NYSE / NCT
Shares Offered
40,000,000 shares (100% primary)
Overallotment Amount
6,000,000 shares (15%)
Use of Proceeds
General corporate purposes, including Excess MSR acquisitions
Joint Bookrunners
Credit Suisse Securities (USA) LLC, Barclays Capital Inc., Citigroup
and UBS Securities LLC
Co-Managers
Keefe, Bruyette & Woods, Inc. and Macquarie Capital (USA)
Inc. 19 |